Loading…


KnowledgeBase
Understanding Campaign Performance
Where to find campaign results#
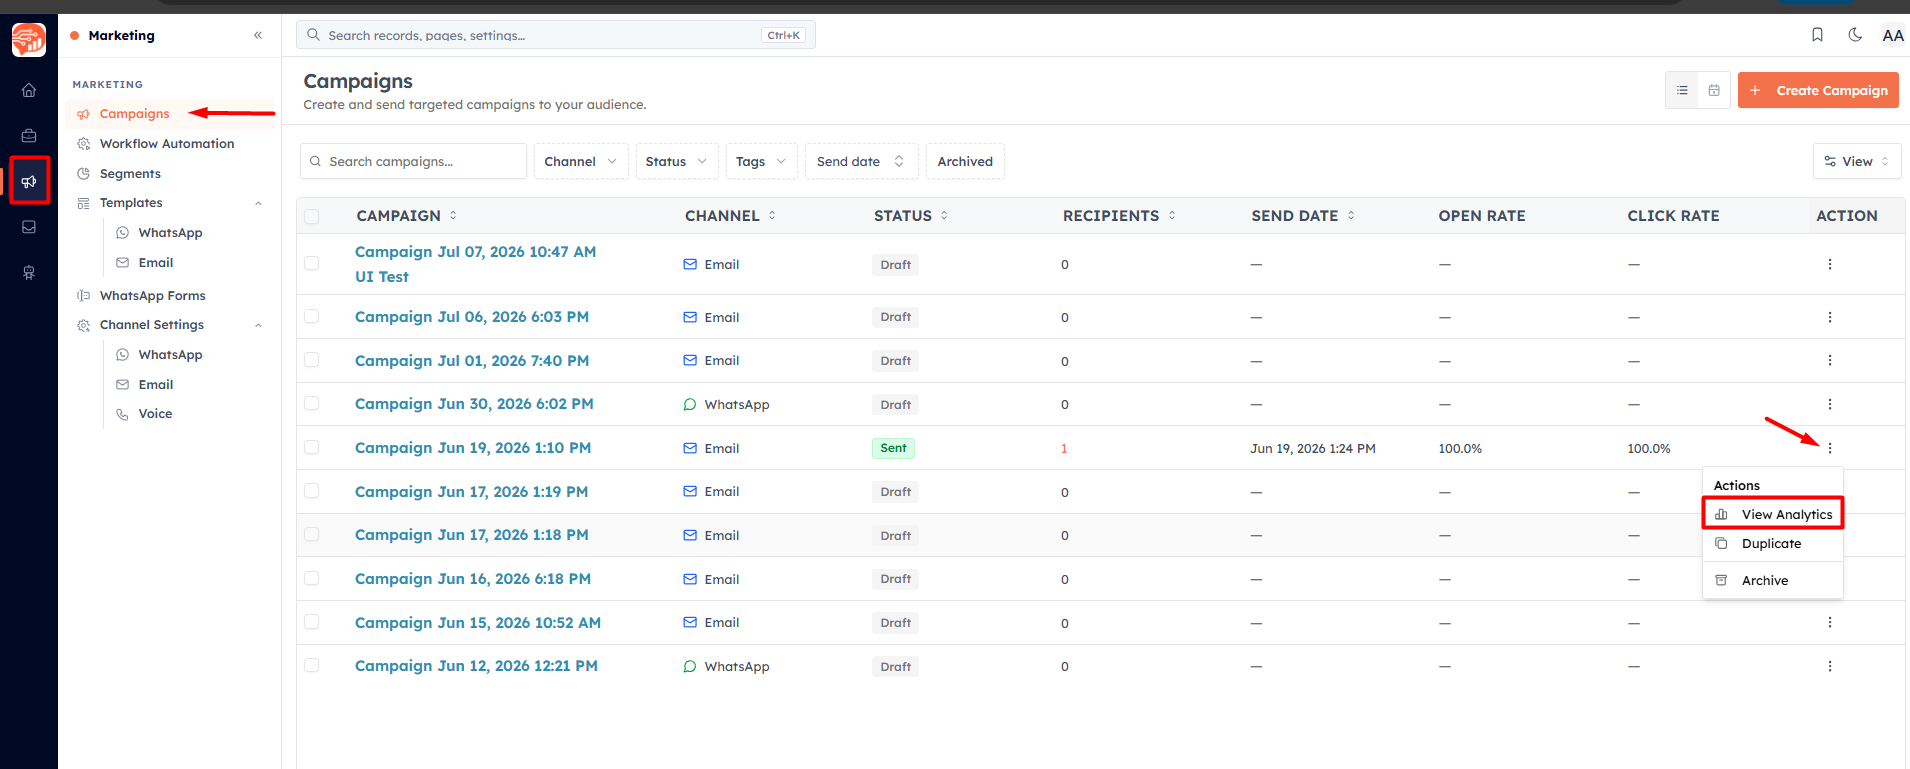
Every campaign you send gets its own analytics report. Go to Marketing → Campaigns, find the campaign in the list, click on the campaign name or click on the menu option and click on View analytics (from the campaign's menu or by opening the campaign). The report opens on the Campaign Analytics page.
💡
Analytics are available once a campaign has started sending. A draft or scheduled campaign that has not gone out yet will show "Analytics not available".
The report at a glance#
At the top, a header card shows the campaign's name, status, channel (Email or WhatsApp), the subject line or template used, who it was sent from, and when it went out. Below that, the report is organised into four tabs: Overview, Message, Audience, and Link activity.
Overview: the six key numbers#
The Overview tab leads with six stat cards. Each shows a count and, where relevant, a percentage rate.
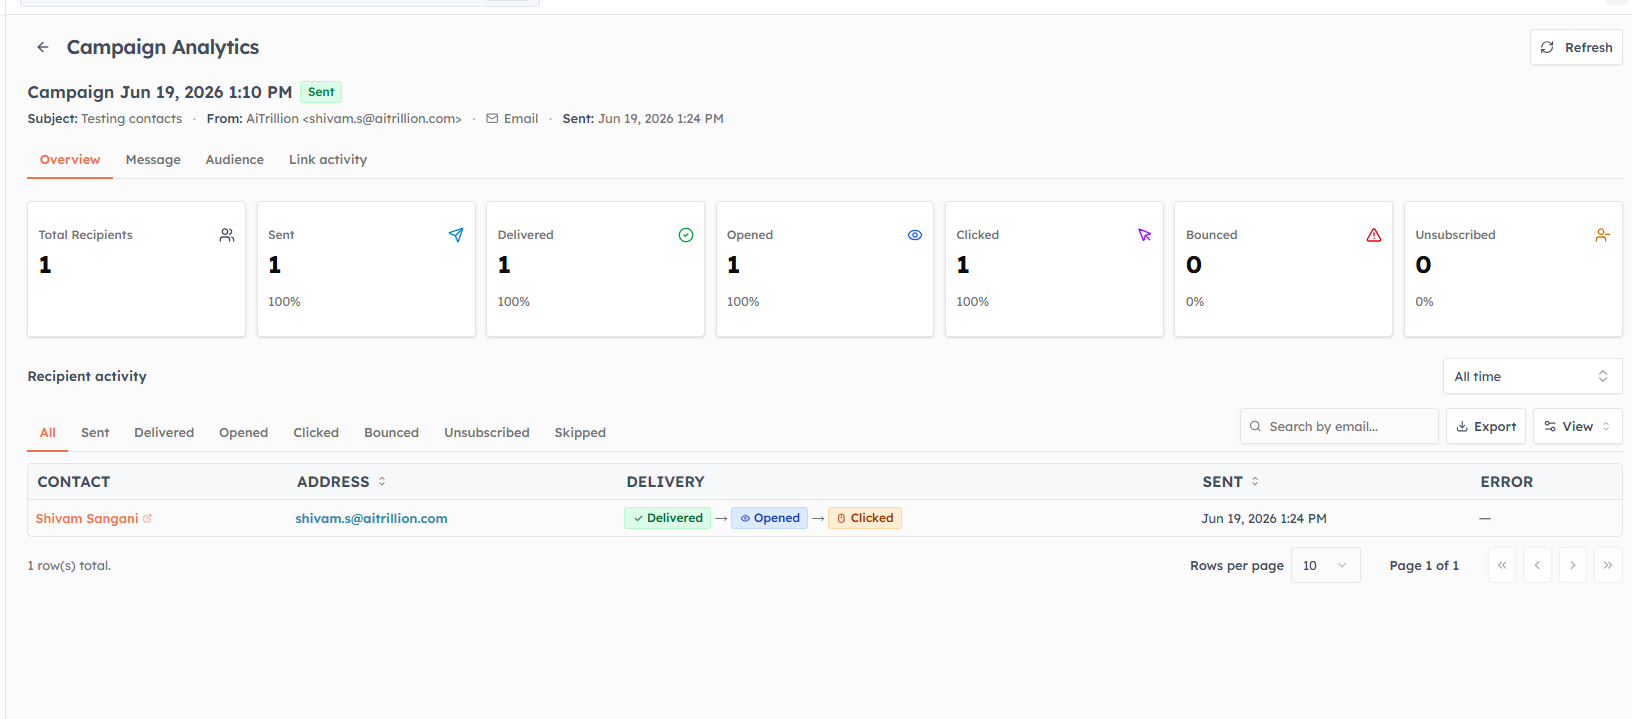
Total Recipients — how many contacts the campaign was sent to (the size of your audience at send time).
Delivered — how many messages actually reached the recipient, shown with a delivery rate. The gap between Total Recipients and Delivered is made up of bounces and failures.
Opened — how many recipients opened the message, with an open rate. (For WhatsApp campaigns this is the read count.)
Clicked — how many recipients clicked a link, with a click rate.
Bounced — how many messages could not be delivered, with a bounce rate.
Unsubscribed — how many recipients opted out via the unsubscribe link, with an unsubscribe rate.
💡
Open rate is measured by a tiny invisible tracking image. Some email apps block images by default, so a few opens go uncounted — your true open rate is usually a little higher than the number shown.
Skipped and failed#
Just under the stat cards, two summary pills appear when relevant:
Skipped (Smart Sending) — contacts the CRM deliberately did not message because they were contacted very recently. Smart Sending protects your audience from being over-messaged.
Failed — messages that could not be processed for sending at all (distinct from a bounce, which is rejected by the recipient's mail server).
Top links and bounce breakdown#
When there is data to show, two extra cards appear on the Overview:
Top Links — which links in your message got the most clicks (shown when the campaign has at least one click). This tells you what your audience actually cared about.
Bounce Breakdown — bounces split by type, such as hard (the address does not exist) versus soft (a temporary problem like a full mailbox). Hard-bounced addresses are automatically suppressed from future sends.
💡
A rising hard bounce count means your list has stale or invalid addresses. Clean your list regularly — a high bounce rate damages your sender reputation and pushes more of your email into spam folders.
Recipient activity#
Below the cards, the recipient activity table lists individual recipients and the furthest step each one reached — Delivered → Opened → Clicked, or a terminal state like Bounced, Failed, Skipped, or Unsubscribed. Use it to see exactly who engaged and who to follow up with.
💡
Each recipient's badge reflects the most advanced action they took. Someone who opened and clicked shows as "Clicked"; someone who only opened shows as "Opened".
The Message tab#
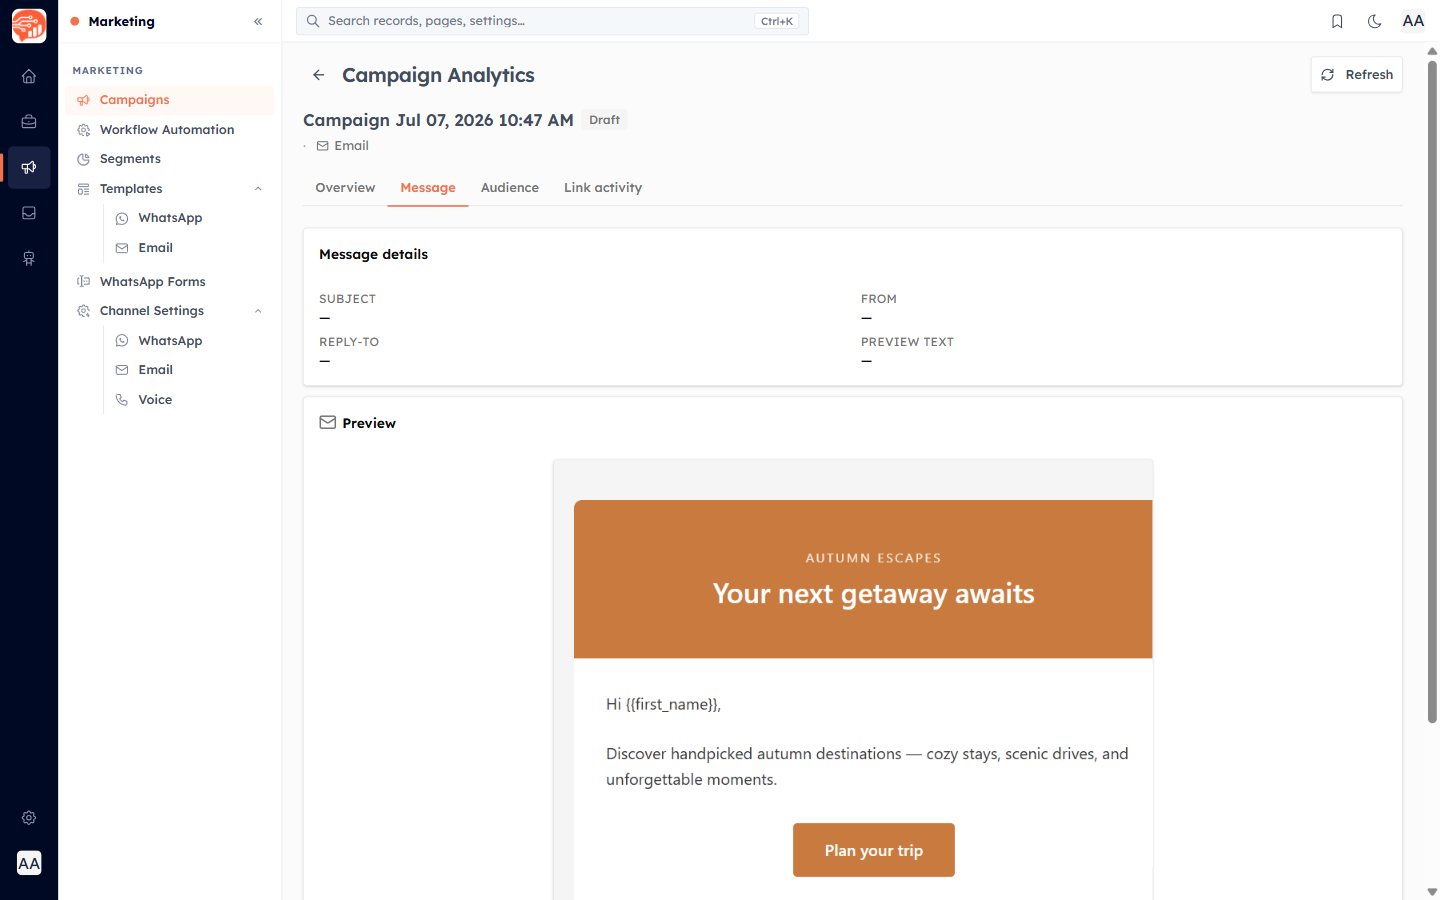
The Message tab shows exactly what you sent — the email design (subject and body) or, for a WhatsApp campaign, the approved template and its content. Use it to review the creative alongside its performance.
The Audience tab#
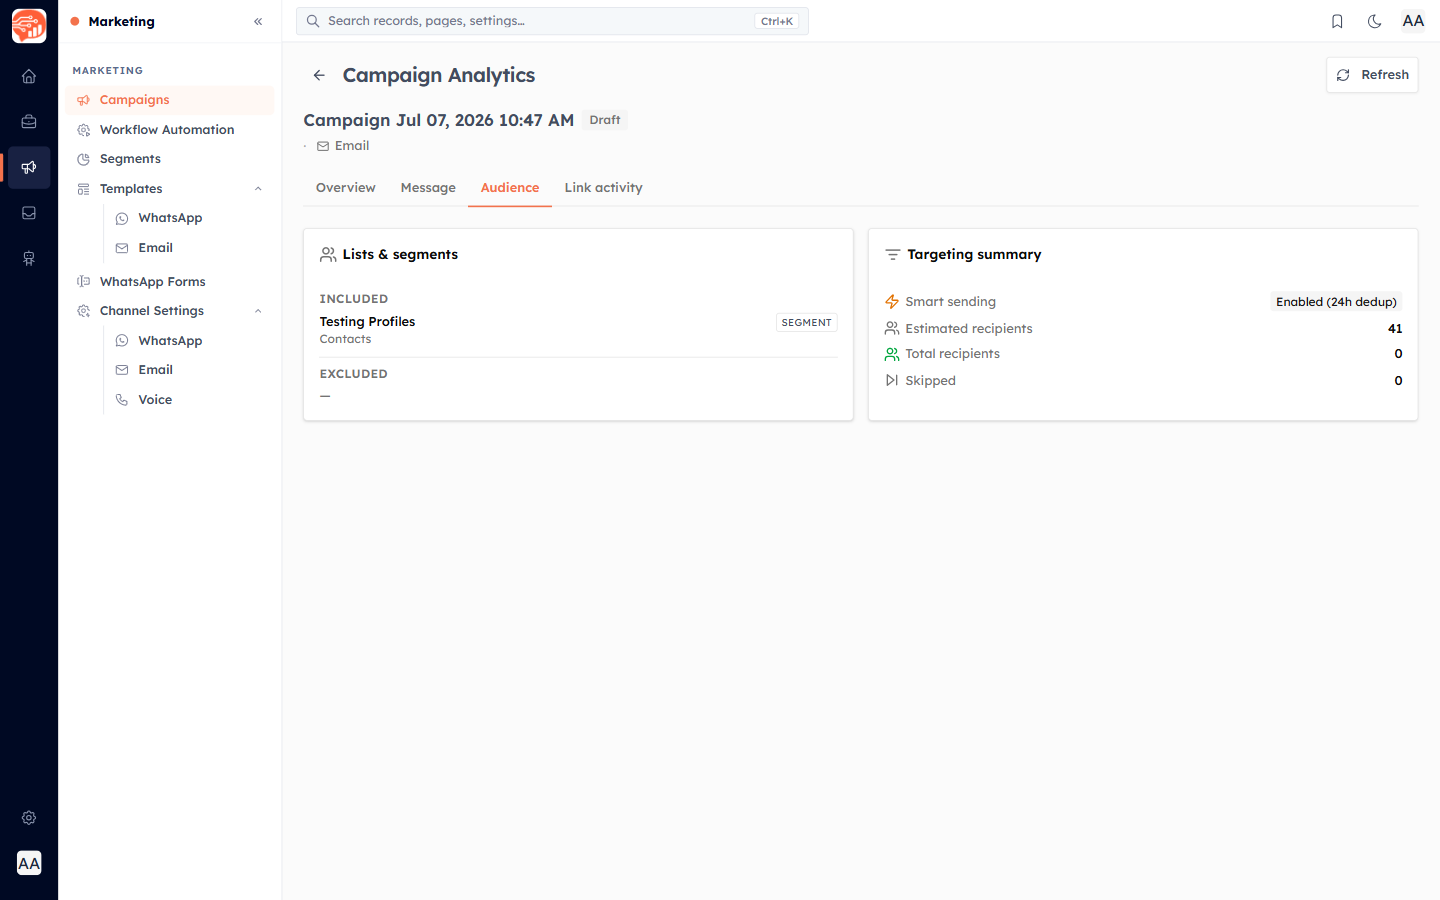
The Audience tab summarises who the campaign went to — the segments or lists you targeted and the resulting recipient counts. It is the quickest way to confirm the campaign reached the audience you intended.
The Link activity tab#
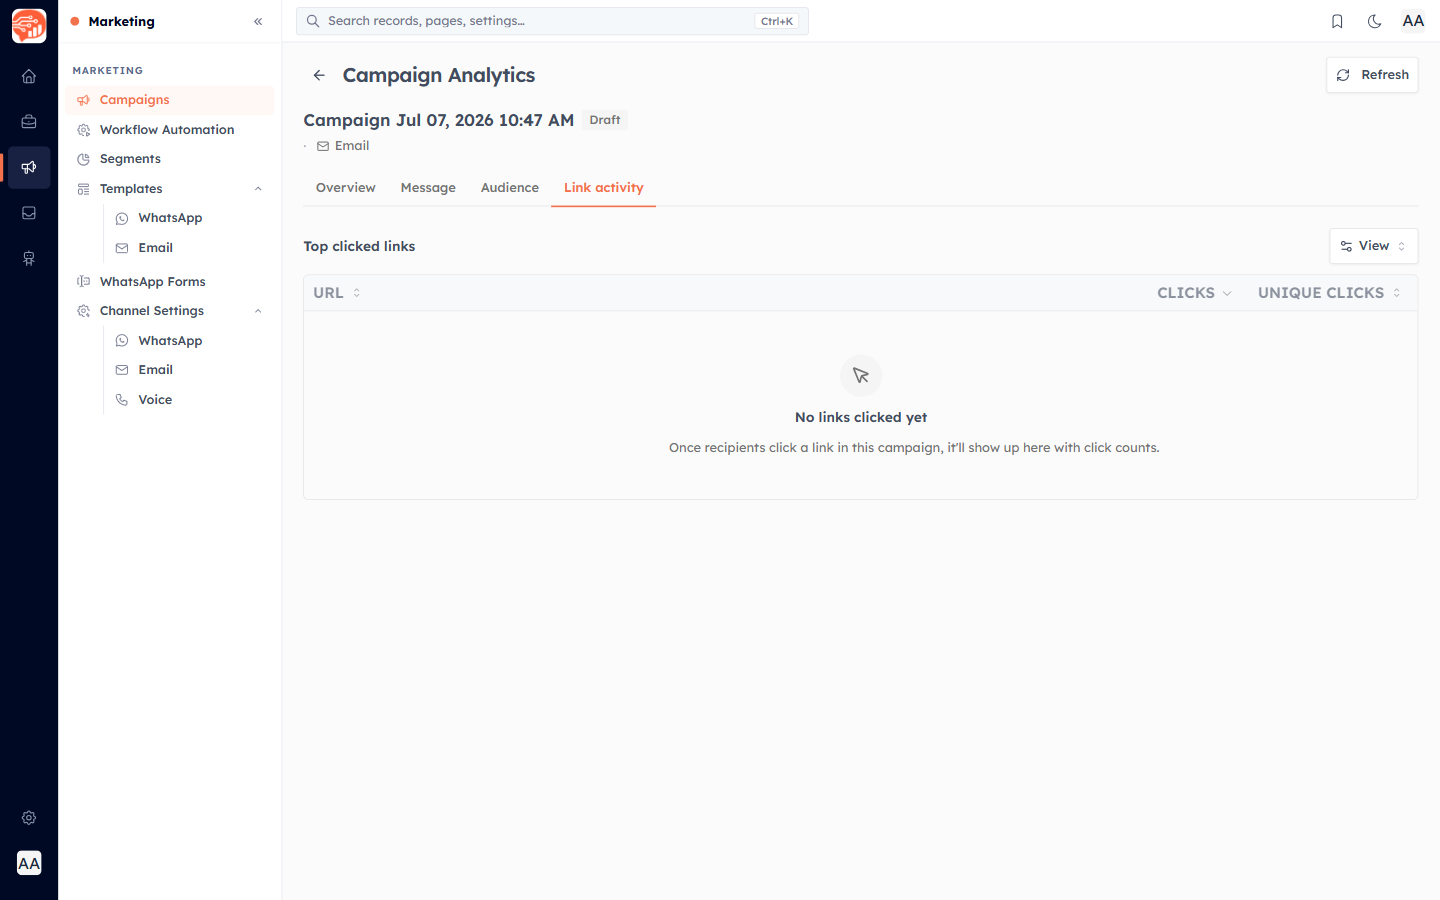
The Link activity tab breaks down engagement by link — every clickable link in your message and how many clicks each received. This is where you learn which call-to-action, product, or article pulled the most interest.
Turning results into improvements#
Low open rate → test different subject lines and sender names; check your send time.
Low click rate → make your call-to-action clearer and more prominent; reduce the number of competing links.
High unsubscribe rate → send less often, or tighten your targeting with a better segment.
High bounce rate → clean your contact list and remove invalid addresses.
Lots skipped by Smart Sending → your audiences overlap or you are sending too frequently; space campaigns out.
💡
Check every campaign's report a day or two after sending, note one thing to improve, and apply it to the next send. Small, steady improvements to subject lines, targeting, and timing compound into far better results over a few months.
Was this article helpful?
Ready to implement this?
OpenAI Engage and apply what you just learned to your own workspace.
Open AI Engage CRM