Loading…


KnowledgeBase
Article Views and Helpful Feedback: See How Many People Read Each Article and Whether It Helped (Step-by-Step)
Introduction#
Once your help center is live, you will want to know two things about every article: is anyone reading it? and did it actually help? AiEngage CRM answers both for you automatically.
Views count how many times customers opened the article on your help center.
Helpful feedback comes from the “Was this article helpful?” box at the end of every article. Customers click Yes or No, and the CRM counts each answer.
You don’t have to set anything up. Both are on for every published article. In this guide we show where the numbers appear in the Knowledge Base list, how to find your most-read articles, what your customers see when they give feedback, and how to use the numbers to decide which articles to improve first.
ℹ️
The screenshots use a sample help center for a business called YourCompany. Your list shows your own articles and numbers.
Before you begin#
Permission: you need the Knowledge Base permission (admins always have it).
Publish your articles. Only published articles can be opened on the help center, so only they collect views and feedback. Drafts always show 0.
Make the help center public so customers can reach it. See Brand and Publish Your Help Center.
Step 1: Open the article list and find the Views and Feedback columns#
In the left rail, click the Knowledge Base (book) icon.
Click Articles at the top of the Knowledge Base menu.
Look at the last columns of the table, just before Action: Views and Feedback.
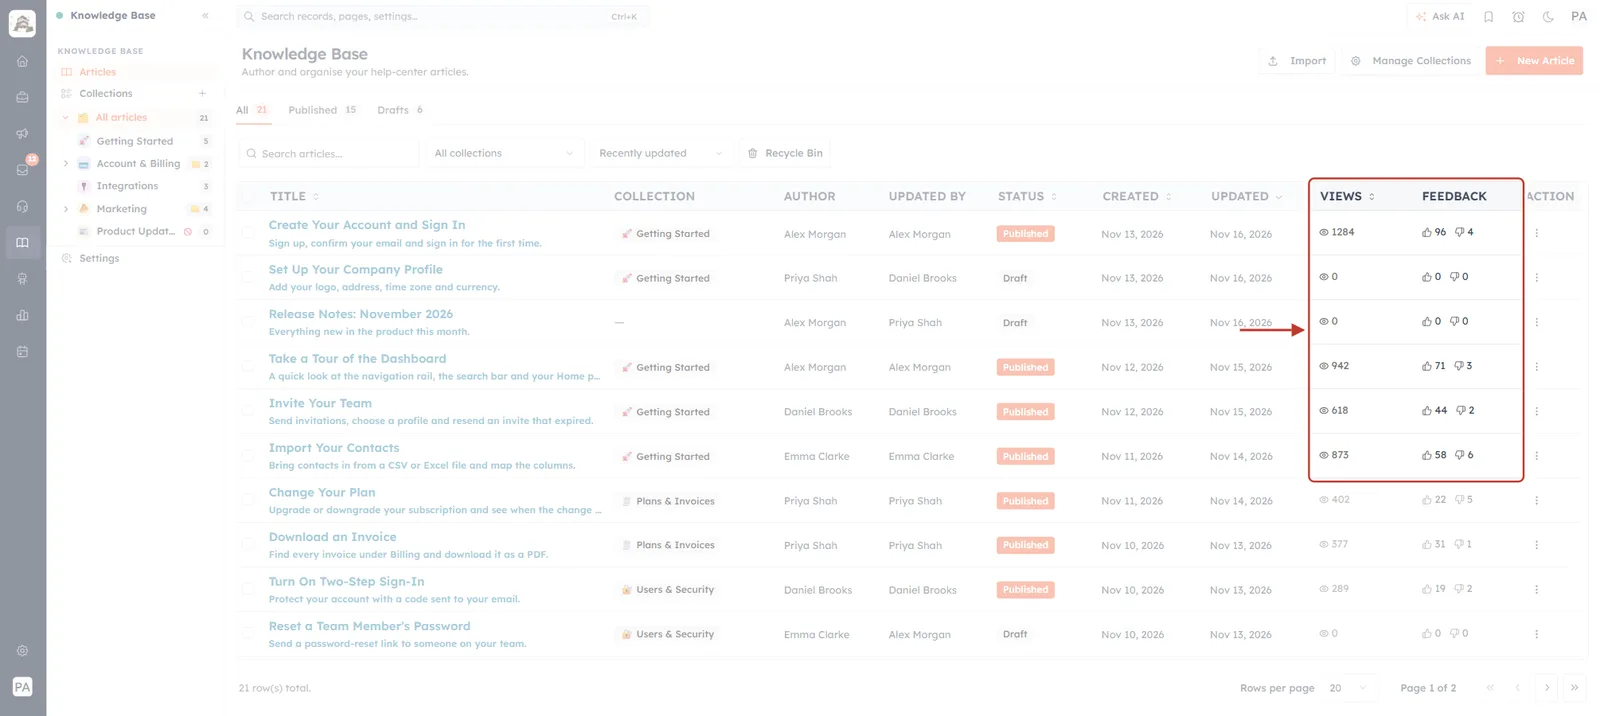
What this screenshot shows. The Knowledge Base page with the list of articles. The red box highlights the Views and Feedback columns on the right side of the table.
Left menu: Articles is selected. Under it, All articles (21) and each collection with its article count.
Top of the page: the Import, Manage Collections and New Article buttons, and the All (21), Published (15) and Drafts (6) tabs.
Filters: a search box, the All collections filter, the sort box (set to Recently updated) and Recycle Bin.
Table columns: Title, Collection, Author, Updated by, Status, Created, Updated, Views, Feedback and Action.
Views (the eye icon): how many times the article was read. For example, Create Your Account and Sign In has 1284 views.
Feedback: the 👍 number is how many readers answered Yes, and the 👎 number is how many answered No. The same article has 96 Yes and 4 No.
✅
On a narrow screen the table scrolls sideways. If you can’t see Views and Feedback, scroll the table to the right or make the browser window wider.
Step 2: Read the numbers for one article#
Each row tells you how one article is doing. Compare a published article with a draft to see the difference.
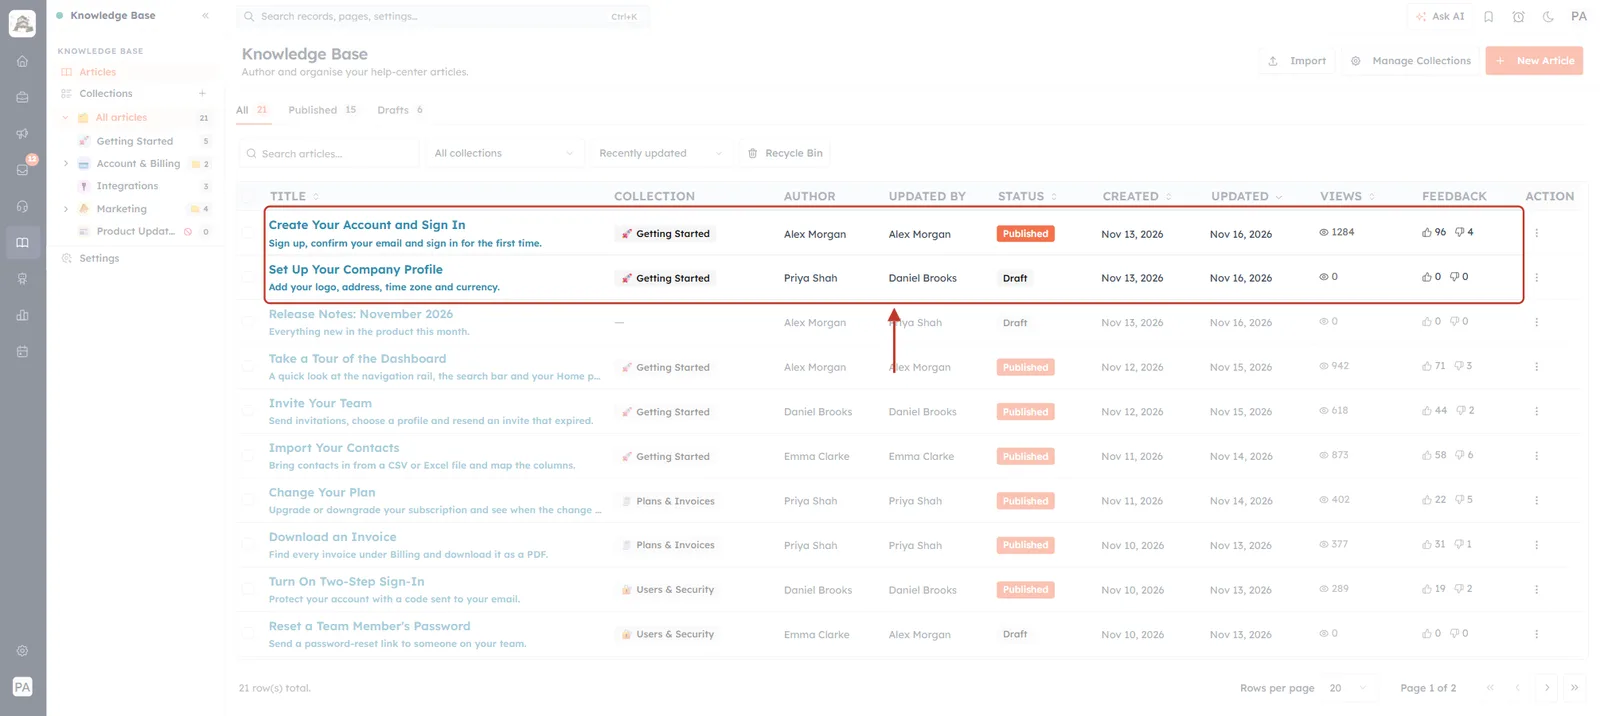
What this screenshot shows. Two rows of the list. The first is a published article with real numbers. The second is a draft, where every number is 0.
Create Your Account and Sign In (coloured Published badge): 1284 views, 96 👍 and 4 👎.
Set Up Your Company Profile (grey Draft badge): 0 views, 0 👍 and 0 👎. Customers can’t open a draft, so it can’t collect views or feedback.
The row also shows the collection (Getting Started), the author, who updated it last and the dates, so you can see who to ask about an article.
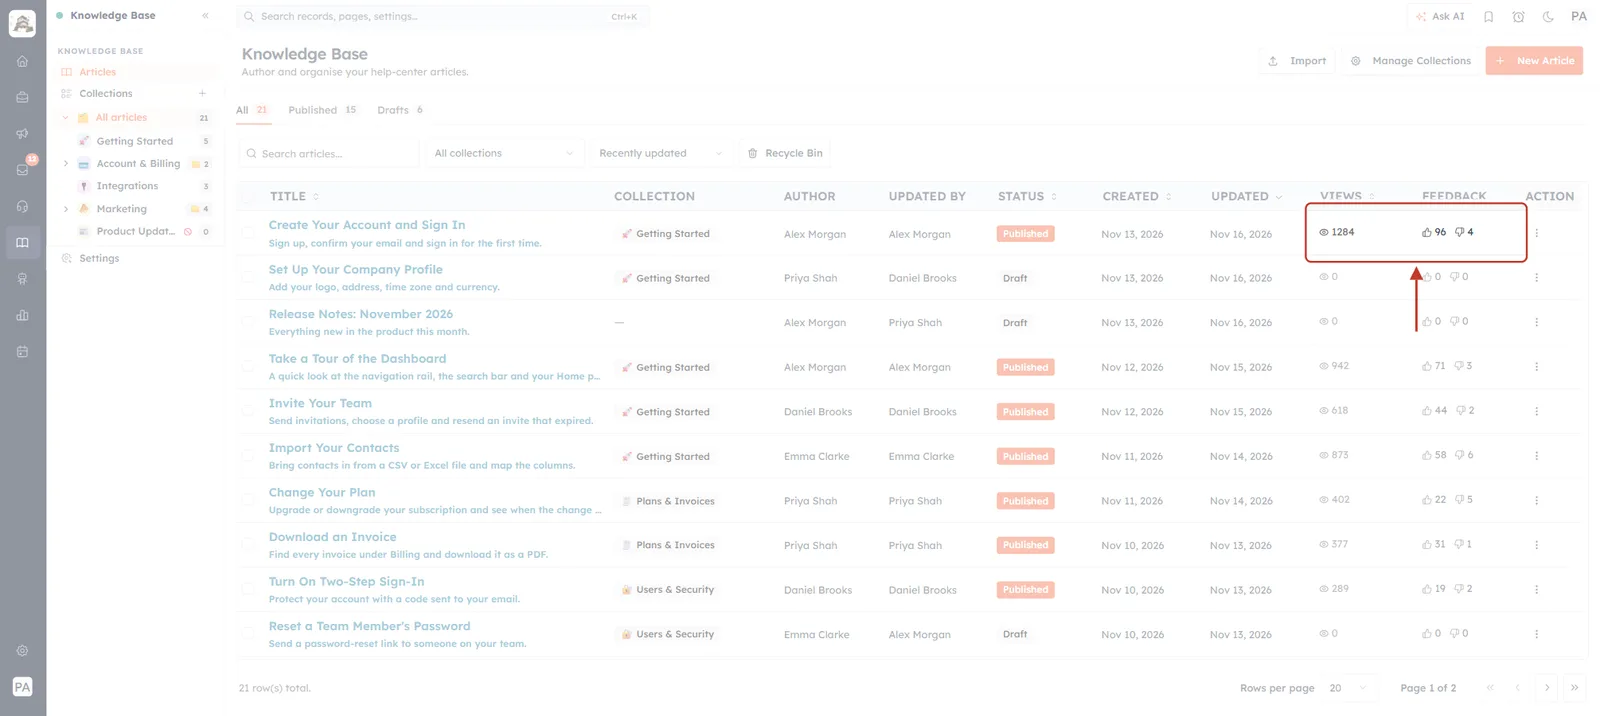
What this screenshot shows. A close-up of the numbers for Create Your Account and Sign In.
👁 1284: the article was opened 1,284 times on your help center.
👍 96: 96 readers clicked Yes to “Was this article helpful?”.
👎 4: 4 readers clicked No and sent the short feedback form.
Quick maths: 96 of 100 answers were Yes, so 96% of readers who answered found it helpful. Only some readers answer, so the votes are always fewer than the views.
Number | What adds to it | What does not |
|---|---|---|
Views | A reader opening the article on your help center. A reader who opens it again in a new browser tab, or another browser or device, adds another view. | Refreshing the article, or opening it again, in the same browser tab. Opening or editing the article in the CRM. |
👍 Yes | A reader clicking Yes in the feedback box. | A reader who already voted on that article in the same browser. The box shows a thank-you message instead. |
👎 No | A reader clicking No and then Send feedback. | Clicking No and then Cancel. Nothing is sent. |
Step 3: Find your most-read articles#
Click the sort box next to All collections. It says Recently updated by default.
Choose Most viewed.
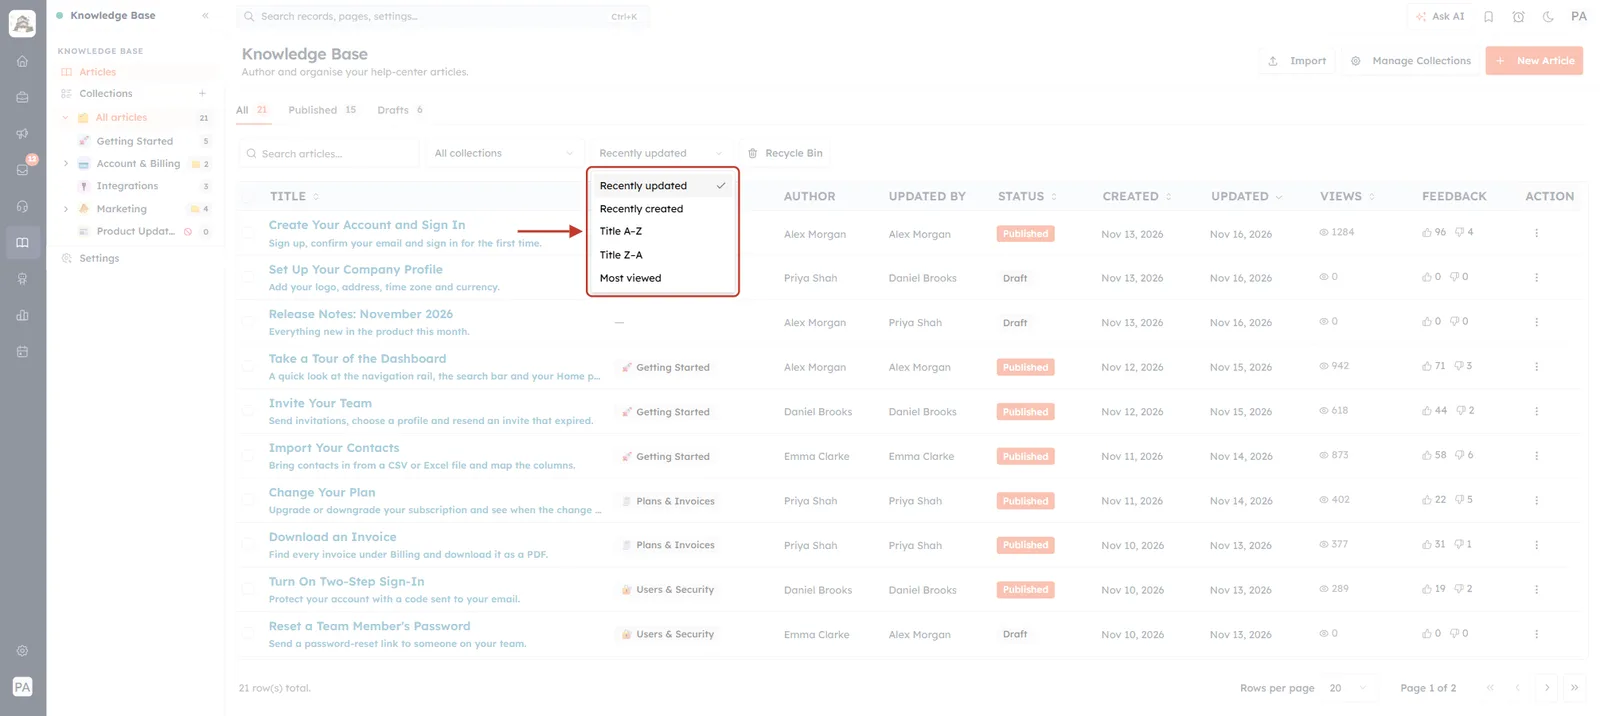
What this screenshot shows. The sort menu is open. The red box highlights the five ways to order the list.
Recently updated (ticked): the default. Articles changed most recently come first.
Recently created: the newest articles first.
Title A–Z and Title Z–A: alphabetical order.
Most viewed: the articles with the most views first. This is the one we want.
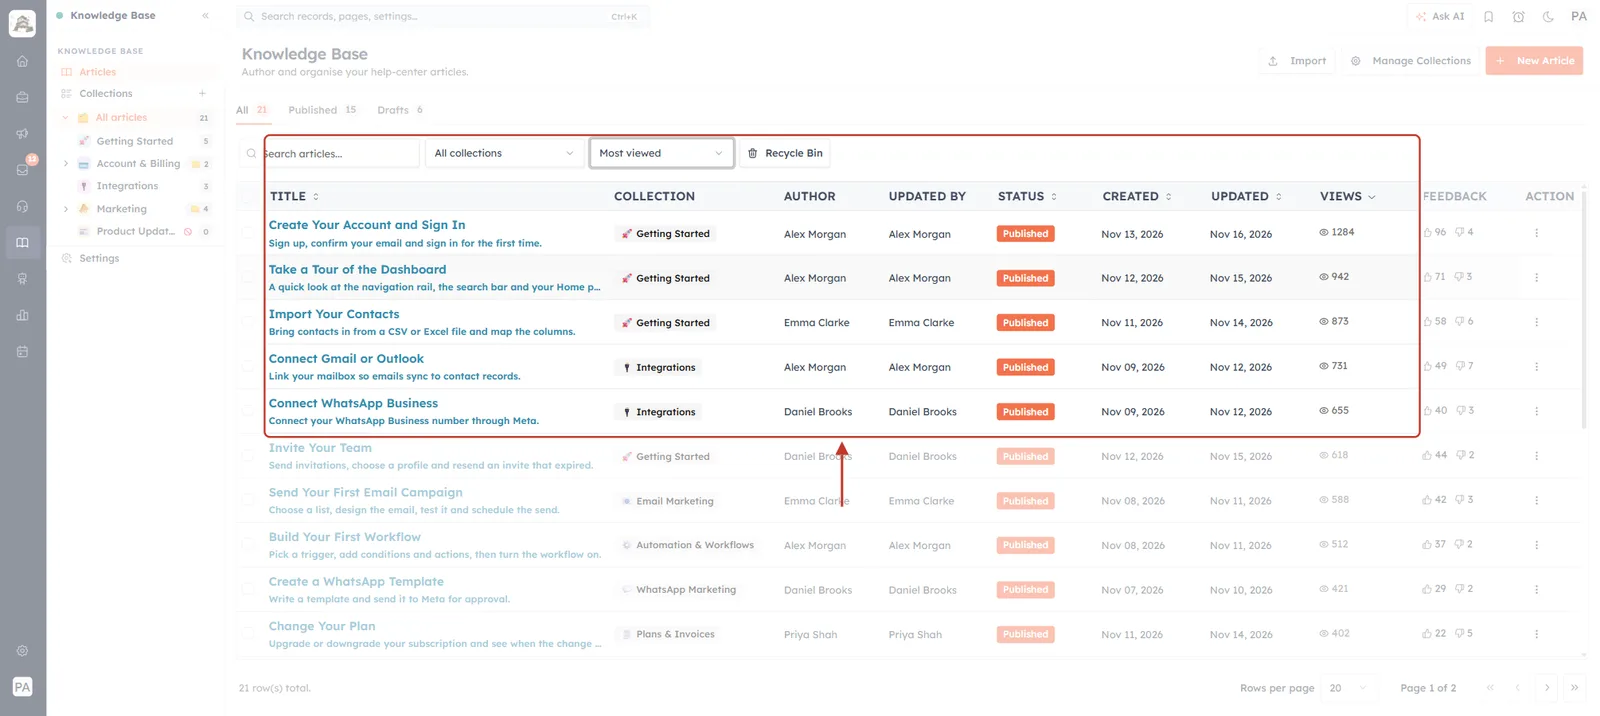
What this screenshot shows. The list after choosing Most viewed. The red box highlights the sort box and the top five articles.
The sort box now shows Most viewed, and the small arrow next to VIEWS points down.
The articles are ordered by views from high to low: Create Your Account and Sign In (1284), Take a Tour of the Dashboard (942), Import Your Contacts (873), Connect Gmail or Outlook (731) and Connect WhatsApp Business (655).
These are the questions your customers ask most. Keep these articles accurate and up to date first.
✅
Combine the sort with the filters. Pick a collection in All collections to see the most-read articles in that collection only, or open the Published tab to hide drafts (they are always 0).
Step 4: Sort from the Views column header (optional)#
You can also sort straight from the table. Click the word Views at the top of the column to open its menu.
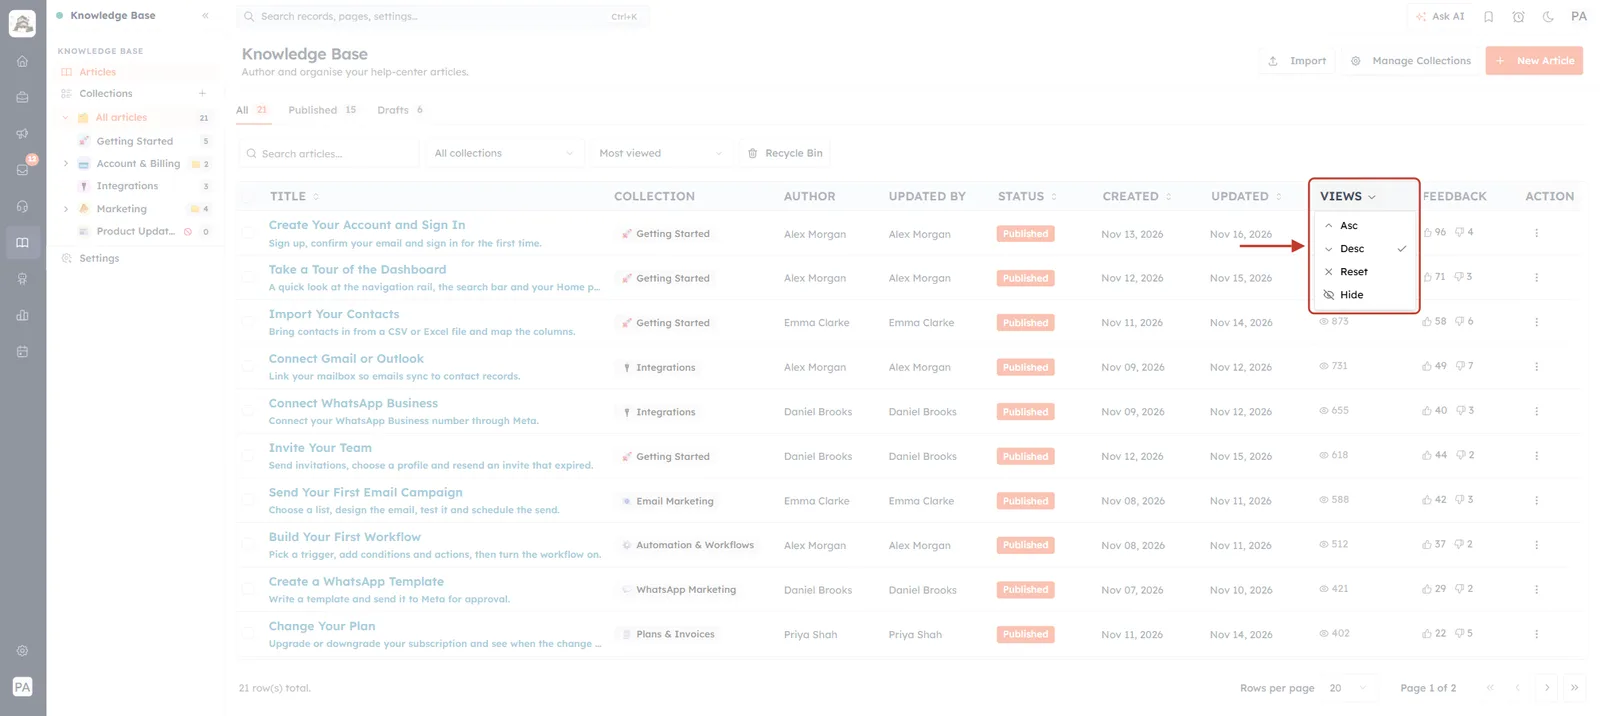
What this screenshot shows. The menu under the VIEWS column header. The red box highlights the header and its four options.
Asc: fewest views first. Use it to find articles that nobody reads.
Desc (ticked here, because the list is sorted by Most viewed): most views first.
Reset: removes this sort and goes back to the default order.
Hide: hides the Views column from the table.
The Feedback column has no menu. You can’t sort by feedback, so check the 👍 and 👎 numbers by eye.
ℹ️
When you choose Asc in the column menu, the sort box above the table goes blank because “fewest views first” isn’t one of its options. Pick an option in the sort box to switch back.
Step 5: See the feedback box your customers see#
Every published article on your help center ends with the same short question. You can see it on your live help center, or privately with Open preview.
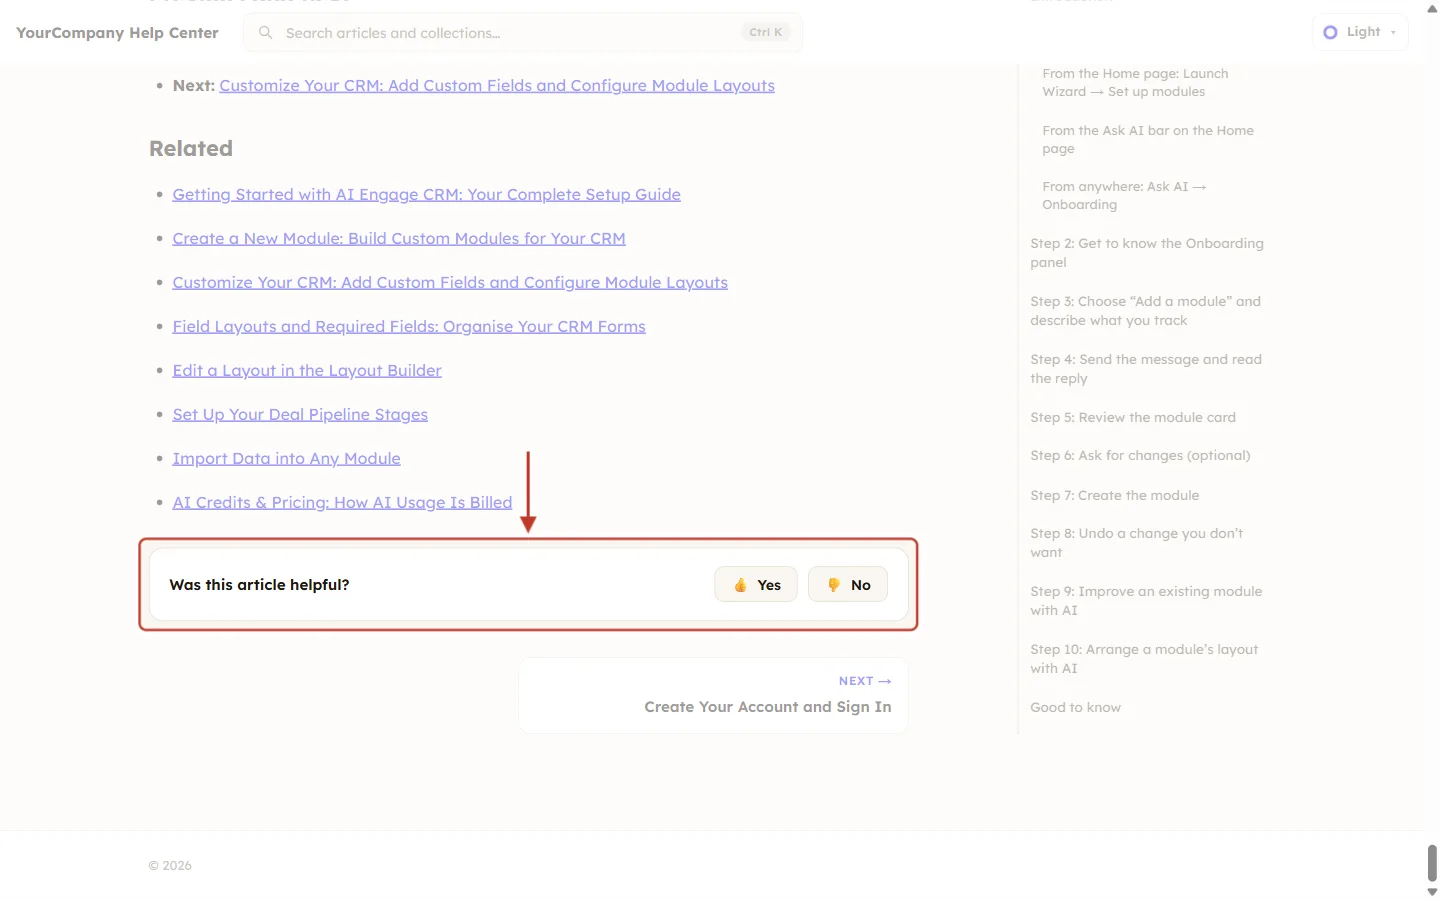
What this screenshot shows. The end of an article on the YourCompany Help Center. The red box highlights the feedback box.
Was this article helpful?: the question shown at the end of every published article, after the article text and the Related links.
👍 Yes and 👎 No: the two answers a reader can give.
Below the box is the NEXT card, which takes the reader to the next article.
You don’t have to add this box. It appears on every published article automatically.
Step 6: What happens when a reader clicks Yes#
One click is all it takes. The vote is sent straight away and adds 1 to the 👍 number for that article.
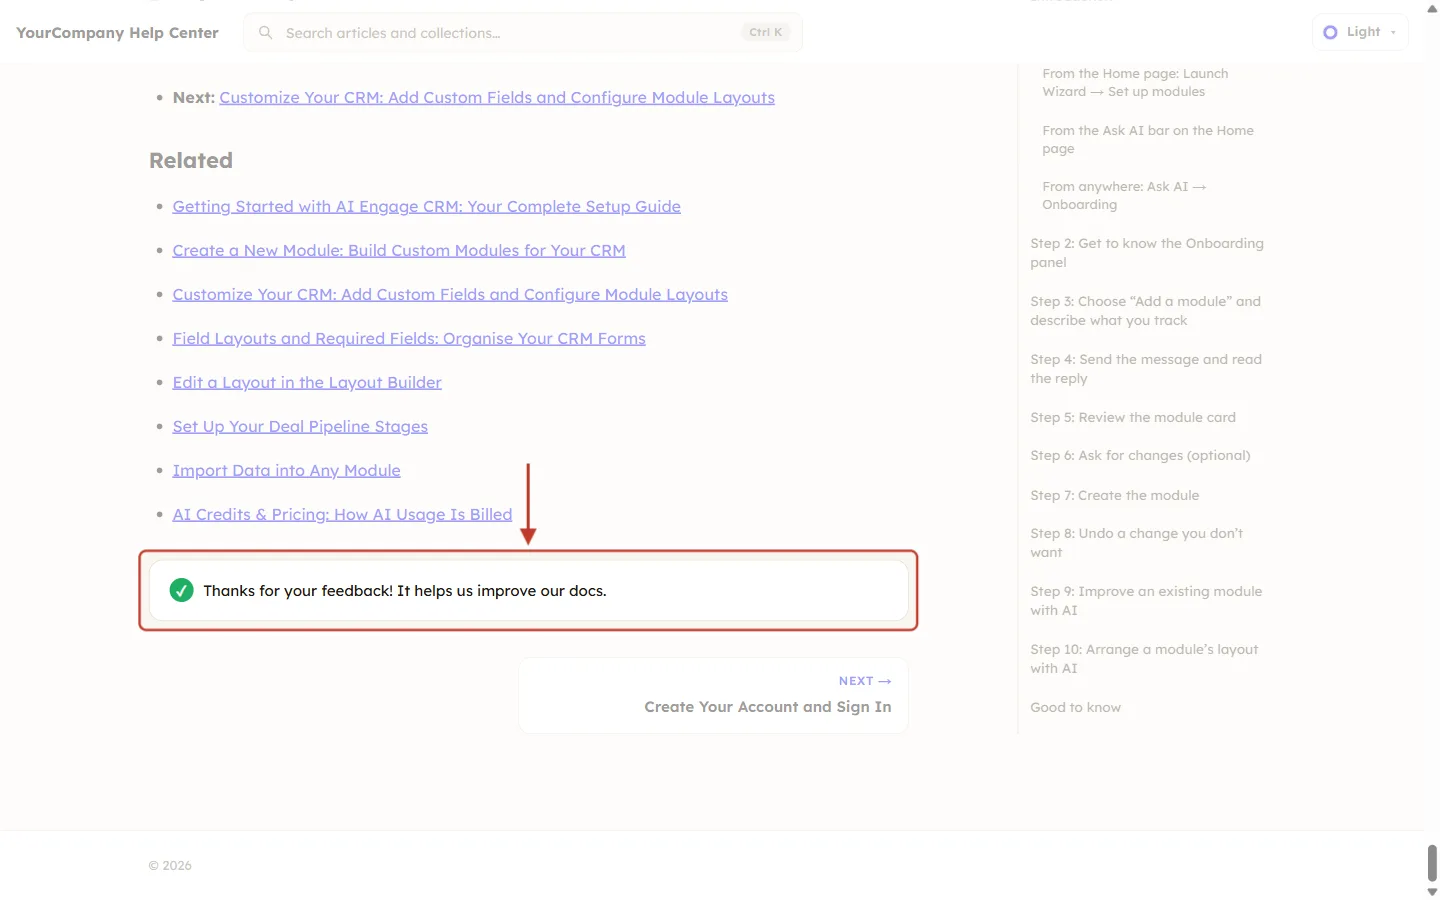
What this screenshot shows. The feedback box after the reader clicked Yes. The red box highlights the thank-you message.
The question and buttons are replaced by a green tick and “Thanks for your feedback! It helps us improve our docs.”
The browser remembers the vote. If the reader comes back to the article in the same browser, they see this message again instead of the buttons, so each reader votes once per article.
The same message appears after a reader sends the No form (Steps 7 and 8).
Step 7: What happens when a reader clicks No#
Clicking No doesn’t count a vote yet. It opens a short form so the reader can tell you what was wrong.
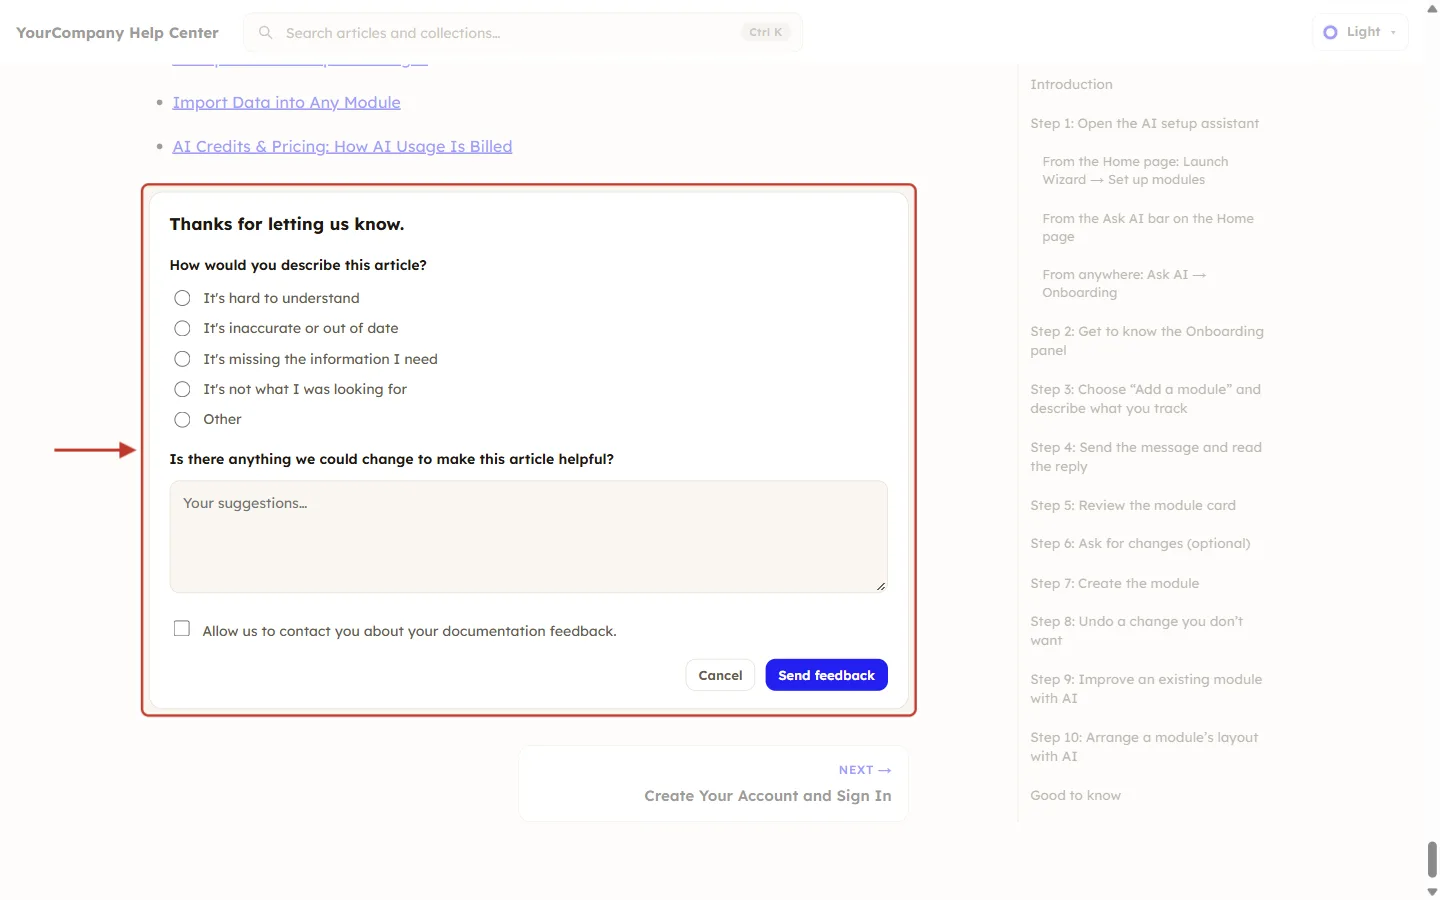
What this screenshot shows. The form that opens after the reader clicked No. The red box highlights the whole form.
Thanks for letting us know.: the form title.
How would you describe this article?: five reasons to choose from: It’s hard to understand, It’s inaccurate or out of date, It’s missing the information I need, It’s not what I was looking for and Other.
Is there anything we could change to make this article helpful?: a box for the reader’s own words (“Your suggestions…”).
Allow us to contact you about your documentation feedback.: a tick box. When it is ticked, an email box appears.
Cancel closes the form and shows the Yes / No question again. Nothing is counted.
Send feedback sends the answer and adds 1 to the 👎 number.
Step 8: The reader fills in and sends the form#
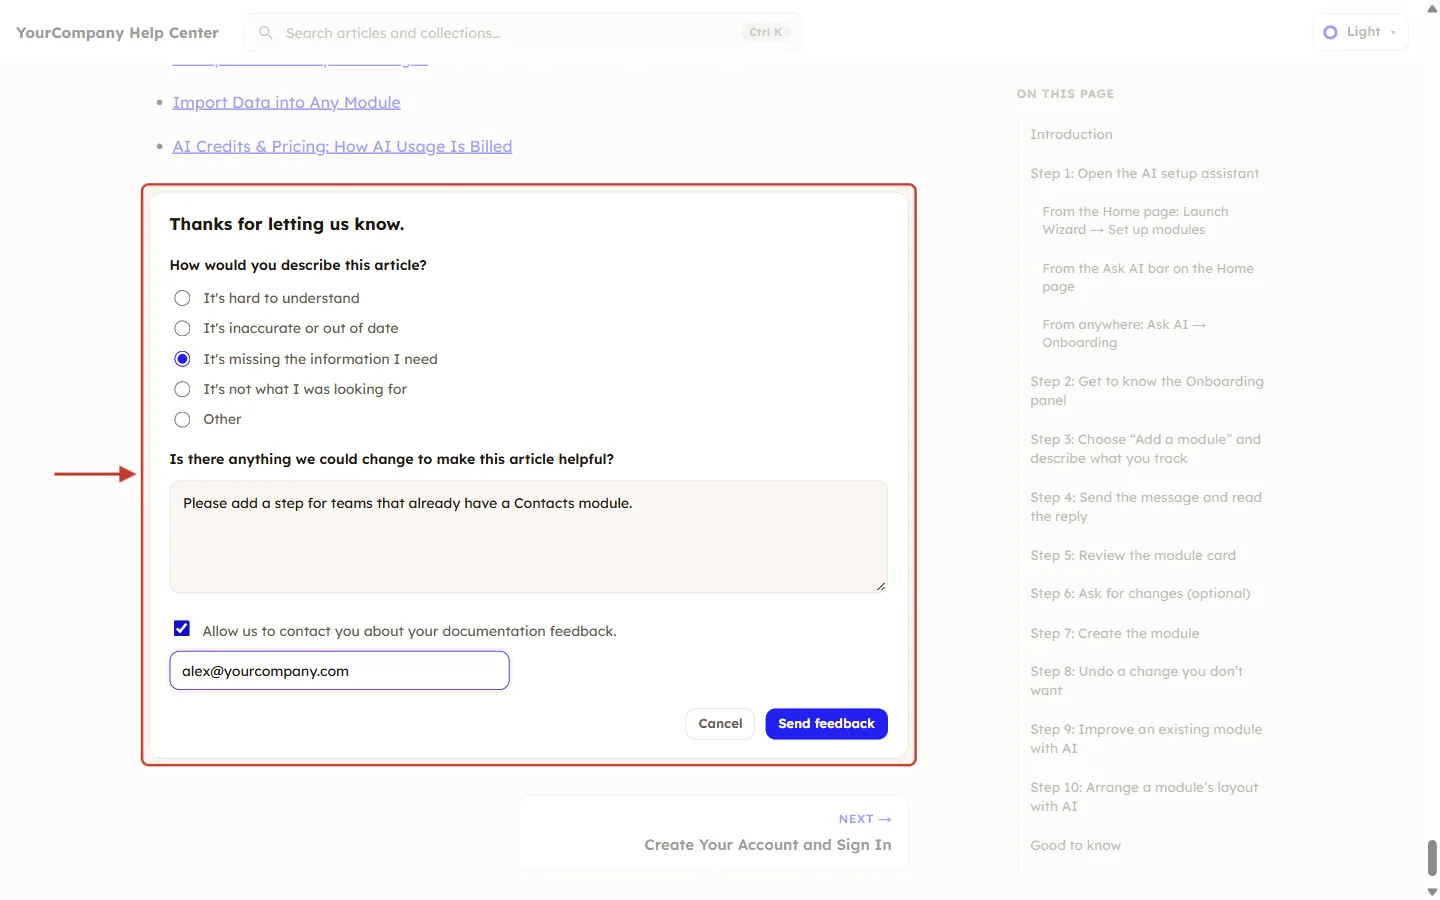
What this screenshot shows. A completed form, ready to send. The red box highlights everything the reader filled in.
Reason: It’s missing the information I need is selected.
Suggestion: “Please add a step for teams that already have a Contacts module.”
Contact: the tick box is ticked and the reader typed their email address, alex@yourcompany.com.
The reader clicks Send feedback. The form is replaced by “Thanks for your feedback! It helps us improve our docs.” (the same message as in Step 6).
ℹ️
All parts of the form are optional. A reader can click Send feedback without choosing a reason or writing a comment, and it still counts as a 👎 vote. The email is only needed when the contact box is ticked.
Step 9: The email check#
If the reader ticks the contact box, the email address must be complete, so you can actually reach them.
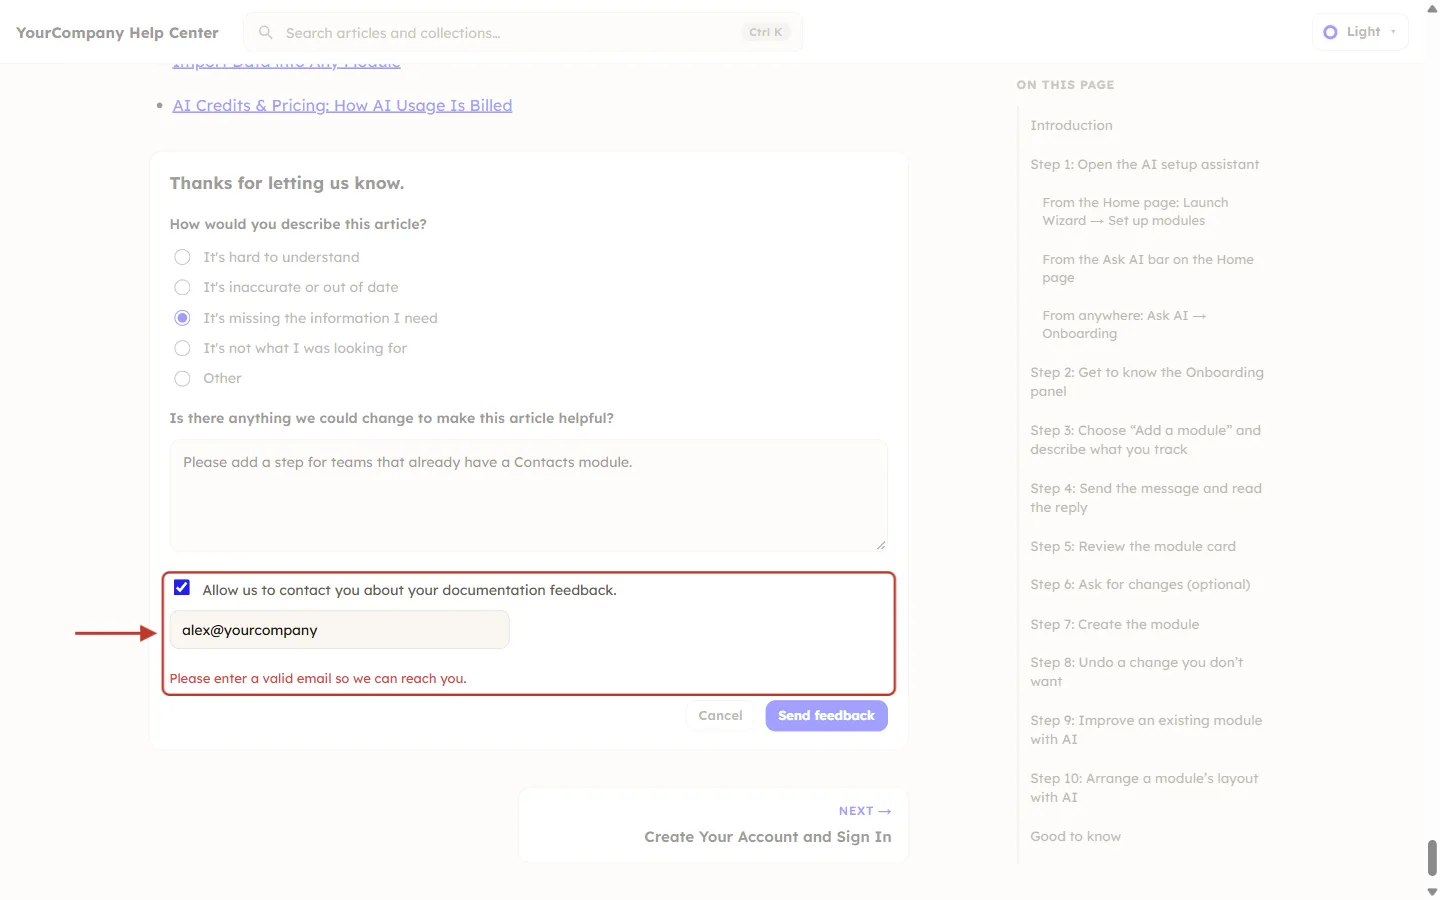
What this screenshot shows. The reader typed an incomplete address and clicked Send feedback. The red box highlights the contact tick box, the email box and the error.
The email box contains alex@yourcompany, which is missing the ending such as .com.
The red message “Please enter a valid email so we can reach you.” appears under the box, and nothing is sent.
The reader corrects the address (or unticks the box) and clicks Send feedback again.
If sending fails for another reason, for example a lost internet connection, the reader sees “Could not send your feedback. Please try again.” and can click Send feedback again.
Step 10: Use the numbers to improve your articles#
Check the list regularly, for example once a month, sorted by Most viewed. Use this table to decide what to do with each article.
What you see | What it usually means | What to do |
|---|---|---|
Many views, mostly 👍 | The article answers a common question well. | Keep it accurate. Link to it from related articles. |
Many views, a lot of 👎 | Many people need this answer, but the article doesn’t give it. | Fix this article first: check every step against the product, add missing steps and screenshots. |
Few or no views | Customers can’t find it, or nobody needs it. | Use words your customers use in the title and excerpt, check its collection, or merge it into another article. |
Views but no votes | Readers didn’t answer. This is normal for new articles. | Wait for more readers before judging it. |
Click the article title in the list to open it in the editor.
Make your changes and click Save Changes. See Create and Publish a Help-Center Article.
Check the result with Open preview, then watch the 👍 and 👎 numbers over the next few weeks.
✅
Work out the helpful rate: 👍 ÷ (👍 + 👎). For example 96 ÷ (96 + 4) = 96%. Comparing rates is fairer than comparing raw numbers, because popular articles collect more votes of both kinds.
Good to know#
Nothing to switch on. Views and the feedback box work on every published article automatically.
Counts only. The list shows the number of views and the number of Yes and No answers. The reason, suggestion and email a reader adds to a No answer are sent with that vote, but the list shows only the totals.
One vote per article per browser. After voting, the reader sees the thank-you message instead of the buttons.
A view is one visit. Refreshing the article in the same tab doesn’t add a view. Opening it in a new tab, another browser or another device does.
Your own visits count too. Opening your articles on the help center, including from the preview, can add to the views. Editing an article in the CRM does not.
Drafts show 0. Customers can’t open draft articles, so drafts never collect views or feedback.
Troubleshooting#
An article always shows 0 views#
Why it happens: it is a draft, its collection is a draft, or the help center isn’t public yet. How to fix it: publish the article and its collection, and turn on Make my help center public in Settings.
I can’t see the Views or Feedback columns#
Why it happens: the table is wider than your screen, so the last columns are off to the right. How to fix it: scroll the table sideways, or make the browser window wider.
Most viewed doesn’t show the article I expected at the top#
Why it happens: a collection filter or the Published / Drafts tab is limiting the list, or the article is on the next page. How to fix it: choose All collections and the All tab, and check the page buttons at the bottom of the list.
A customer says they can’t vote on an article#
Why it happens: they have already voted on that article in the same browser, so they see the thank-you message instead of the buttons. How to fix it: nothing is wrong. Their first vote has already been counted.
Frequently asked questions#
Do I need to add the “Was this article helpful?” box to my articles?
No. It appears at the end of every published article automatically.
Can I sort the list by feedback?
No. You can sort by views (Most viewed, or the Views column menu). Check the 👍 and 👎 numbers in the Feedback column by eye.
Does clicking No count straight away?
No. It opens a short form. The 👎 vote is counted only when the reader clicks Send feedback. If they click Cancel, nothing is counted.
Can a reader change their vote?
Not from the article. After voting, the reader sees the thank-you message instead of the Yes and No buttons.
Previous and next#
Related#
Was this article helpful?
Ready to implement this?
OpenAI Engage and apply what you just learned to your own workspace.
Open AI Engage CRM