Loading…


KnowledgeBase
Team Inbox Reporting: Conversation Volume, Status and Team Performance
What this report tells you#
Your team answers customers all day in the Team Inbox. Reporting is the screen that steps back and answers the questions you can’t see from inside a chat window:
How much came in? — new people, new chats, and chats that were already running.
Where does it all stand? — how many conversations are still open, on hold, closed, and how many nobody has picked up.
Who is actually replying? — per agent: what they were given, what they answered, and what they left untouched.
Every number on the page is clickable. Instead of just showing you a total, it will show you the exact conversations behind that total — so a number you don’t like turns straight into a to-do list.
ℹ️
This report is about conversations — the two-way chats in your Team Inbox. If you want to know how your outbound template messages performed (sent, delivered, read, clicked), that lives in a separate report: WhatsApp Template Reporting & Delivery Metrics.
Where to find it#
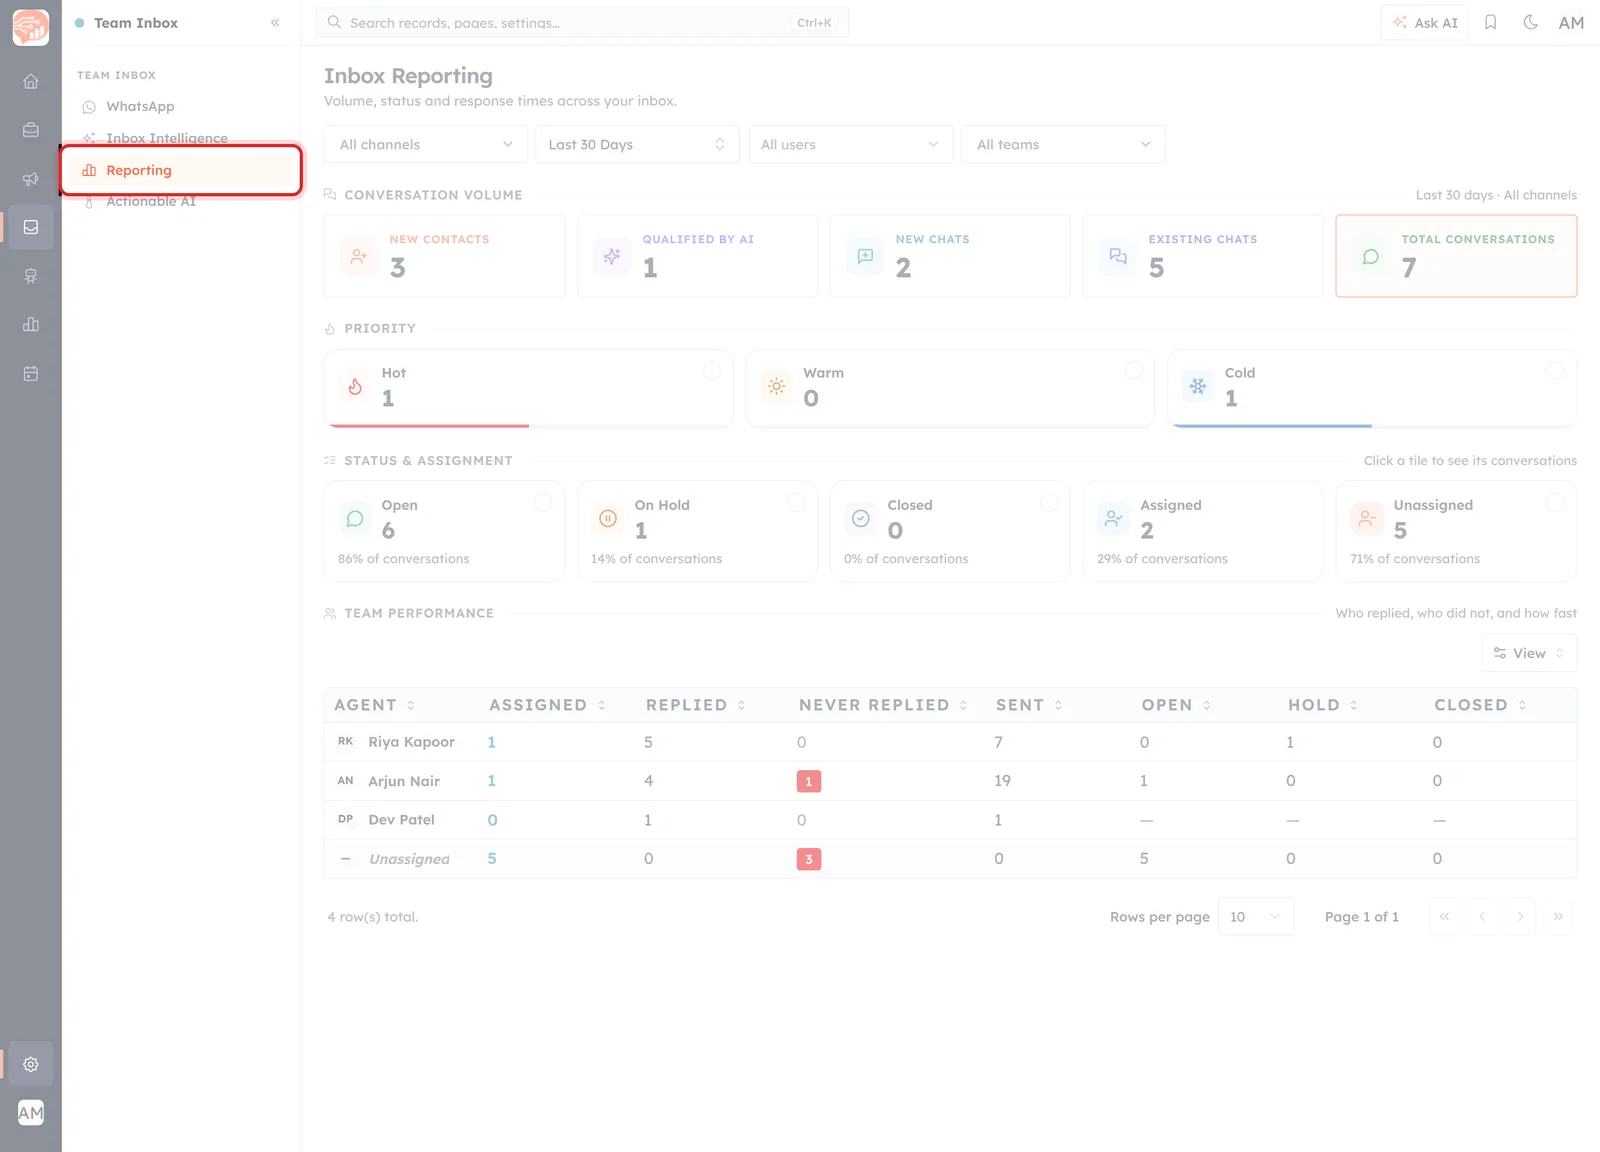
In the left sidebar open Team Inbox and click Reporting. It sits just under WhatsApp and Inbox Intelligence.
Set the window first: the four filters#
The row of dropdowns at the top controls every number below it. Set these before you read anything, otherwise you may be looking at the wrong month or the wrong team.
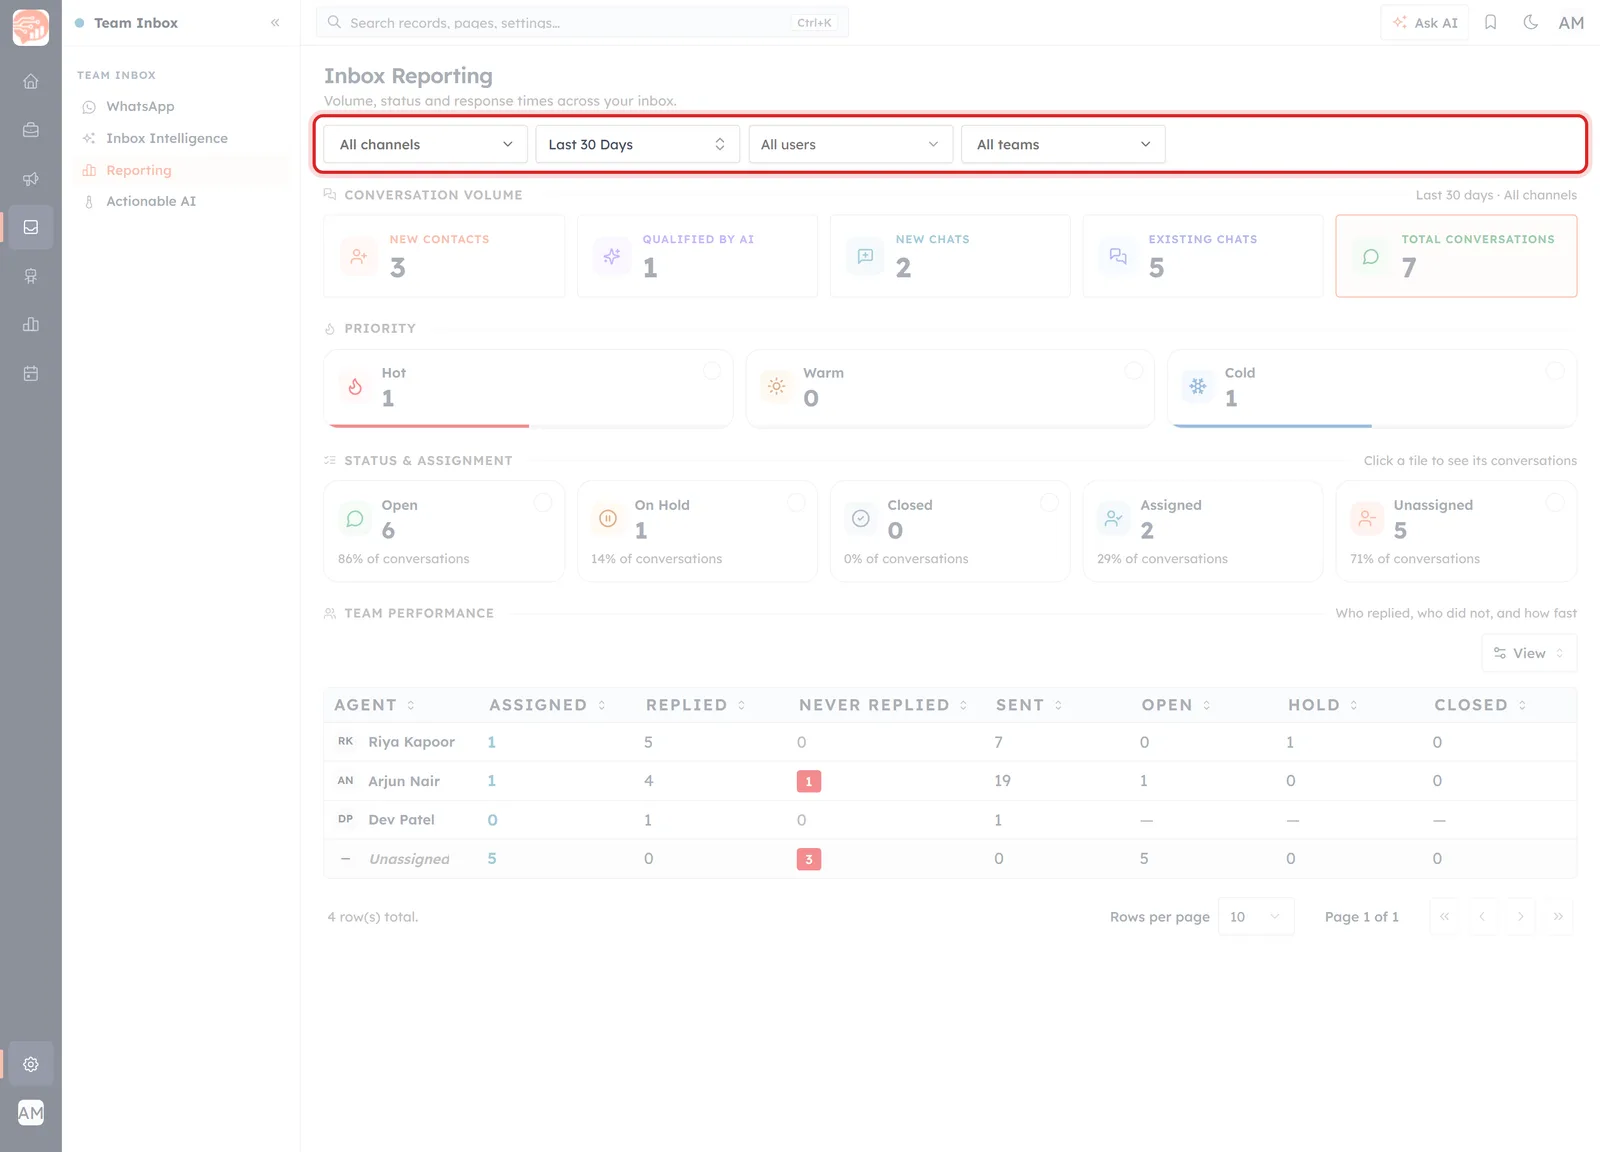
Channel — All channels, WhatsApp, or Bot.
Date range — Today, Yesterday, Last 7 Days, Last 30 Days (the default), current/last week, month, quarter or year, Any Time, or a Custom Range you pick on a calendar.
User — narrow the whole page down to one agent. There’s a search box, so you don’t have to scroll a long list.
Team — narrow it down to one team instead of one person.
As soon as you change anything, a Clear filters link appears next to the dropdowns to put everything back. Your choices are also stored in the page address, so you can bookmark a view you check often, or paste the link to a colleague and they’ll see exactly the same figures.
Conversation volume — how much came in#
The first row of tiles is your workload for the selected period.
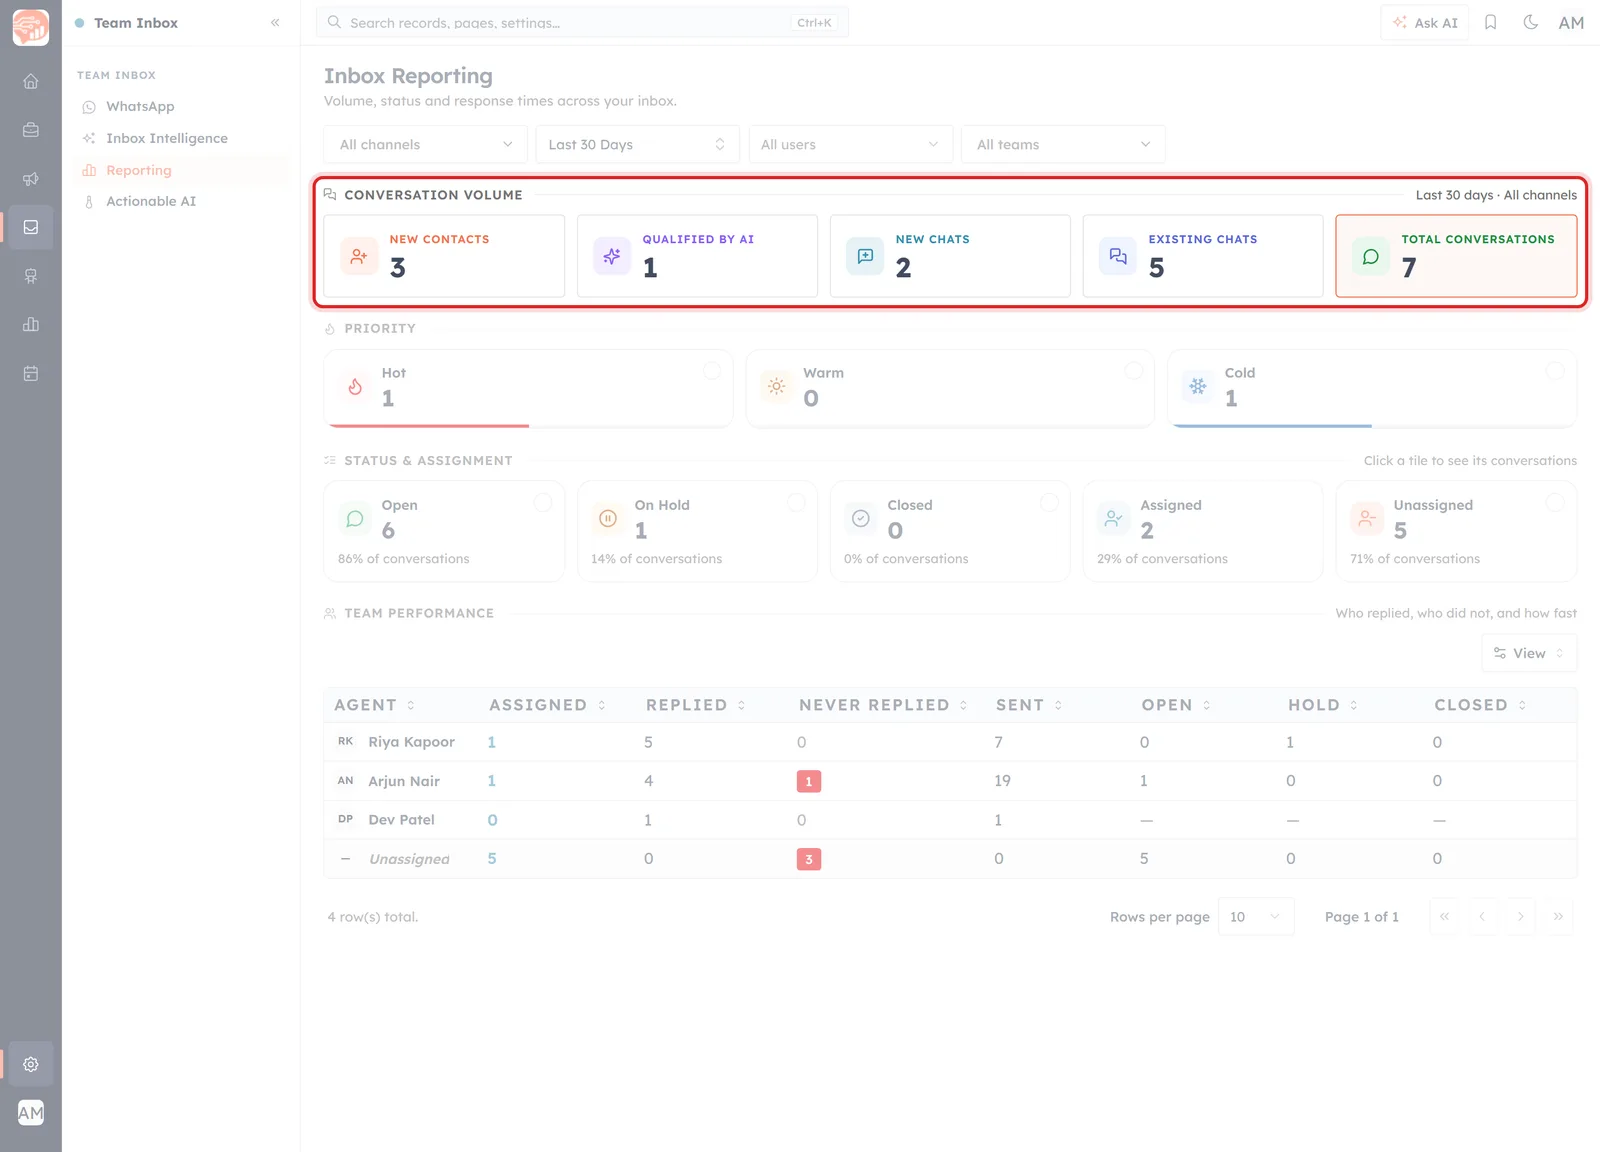
New contacts — people who were created in your CRM during this period and whose first conversation also started in it. In plain terms: brand-new people the inbox brought in.
Qualified by AI — how many of those new contacts an AI agent moved to its qualified stage. This is counted from the contact’s timeline, so leads that a person qualified by hand are not included here.
New chats — conversations that were created inside this period.
Existing chats — conversations that were active in this period but had started earlier. These are your ongoing threads.
Total conversations — everything with any activity in the period (new + existing).
💡
Reading it together tells a story. Lots of New chats but very few New contacts means the same people keep coming back. The reverse means you’re reaching fresh audiences but not building a repeat conversation.
Priority — Hot, Warm and Cold#
Next comes a simple three-tile breakdown of how the conversations in this period are rated: Hot, Warm and Cold. Use it to check that the hot ones are actually being answered first. Conversations that were never given a priority simply don’t appear in these three tiles, so the numbers here can add up to less than your total.
Status & assignment — where everything stands#
This row is the health check. Each tile shows a count and its share of all conversations in the period.
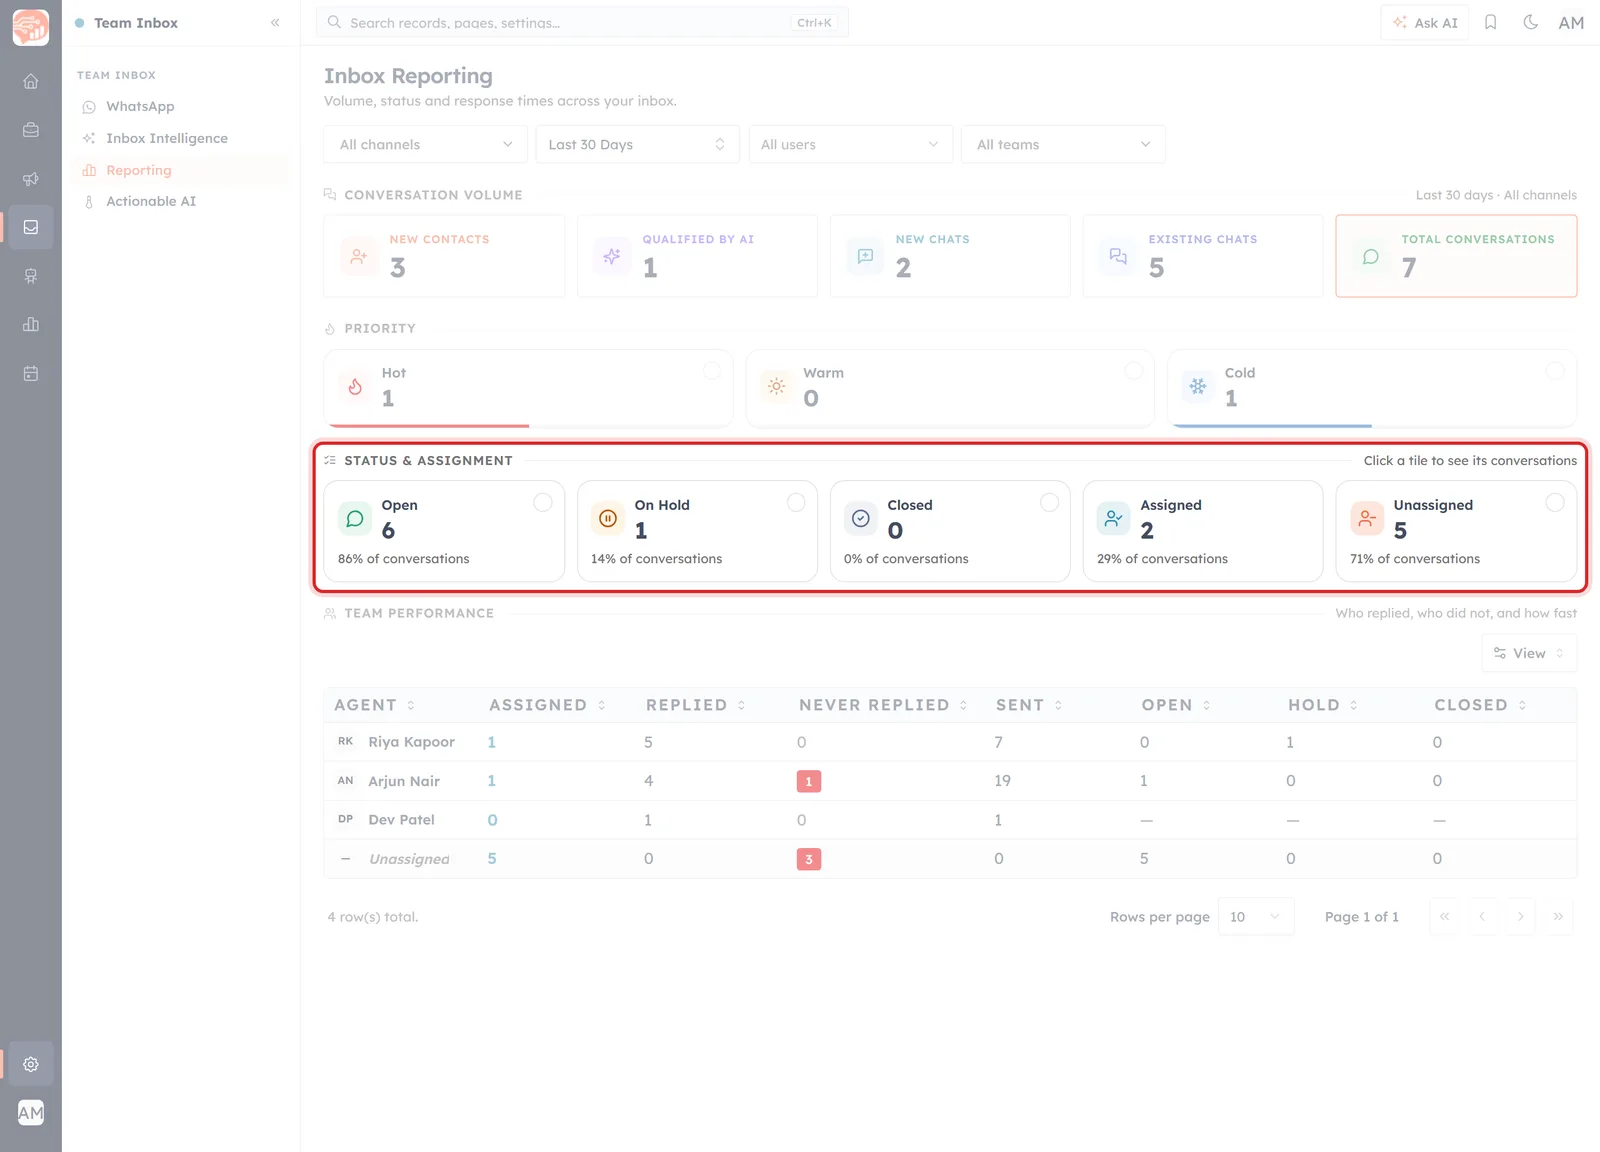
Open — still live and needing attention.
On Hold — parked on purpose, e.g. waiting on the customer or another team.
Closed — finished. This tile counts conversations marked Solved plus any with a Blocked contact, because the inbox has no separate “closed” state.
Assigned — somebody owns it.
Unassigned — nobody owns it yet. This is the open pool that any agent is allowed to pick up.
⚠️
A high Unassigned percentage is the single most useful warning on this page — it means messages are arriving and sitting in the open pool without an owner. Click that tile to see exactly which chats are waiting.
Team performance — who replied, who did not#
The table at the bottom is the per-agent view. There’s one row per agent, plus a final Unassigned row that represents the open pool.
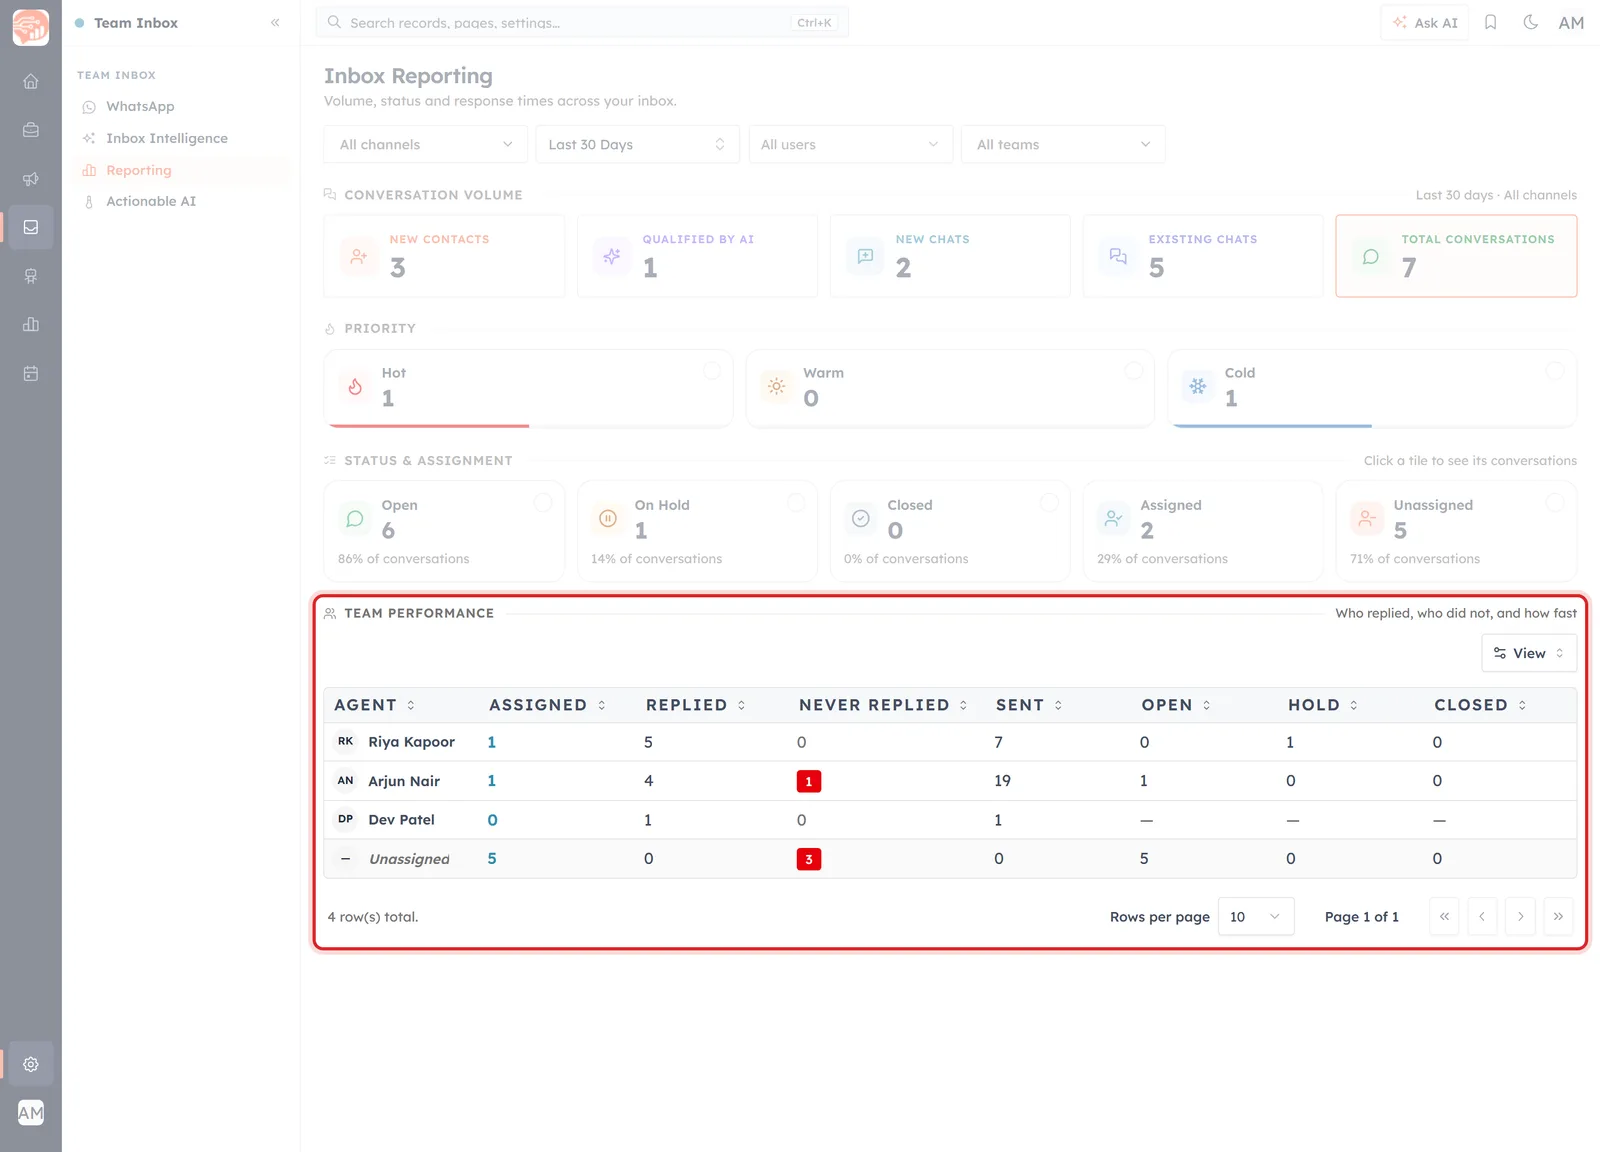
Assigned — conversations handed to that agent in this period.
Replied — conversations they actually answered.
Never replied — conversations assigned to them in this period that nobody has answered yet. This one is shown as a red badge, because it’s the number worth acting on. A thread that the AI answered is not counted here.
Sent — how many messages that agent sent in total.
Open / Hold / Closed — how their conversations are currently split.
Click any column header to sort by it, and use the View button above the table to show or hide columns so you only see what you care about. Long teams are paginated — change Rows per page at the bottom.
✅
A healthy row has Replied close to Assigned and Never replied at zero. If an agent shows a high Assigned with a low Replied, they’re holding conversations they haven’t got to — that’s a workload problem, not necessarily a performance one.
Click any number to see the conversations behind it#
This is the part that turns the report into work. Click a status tile, a priority tile, Total conversations, or an agent’s row in the table, and a panel slides in listing exactly those conversations.
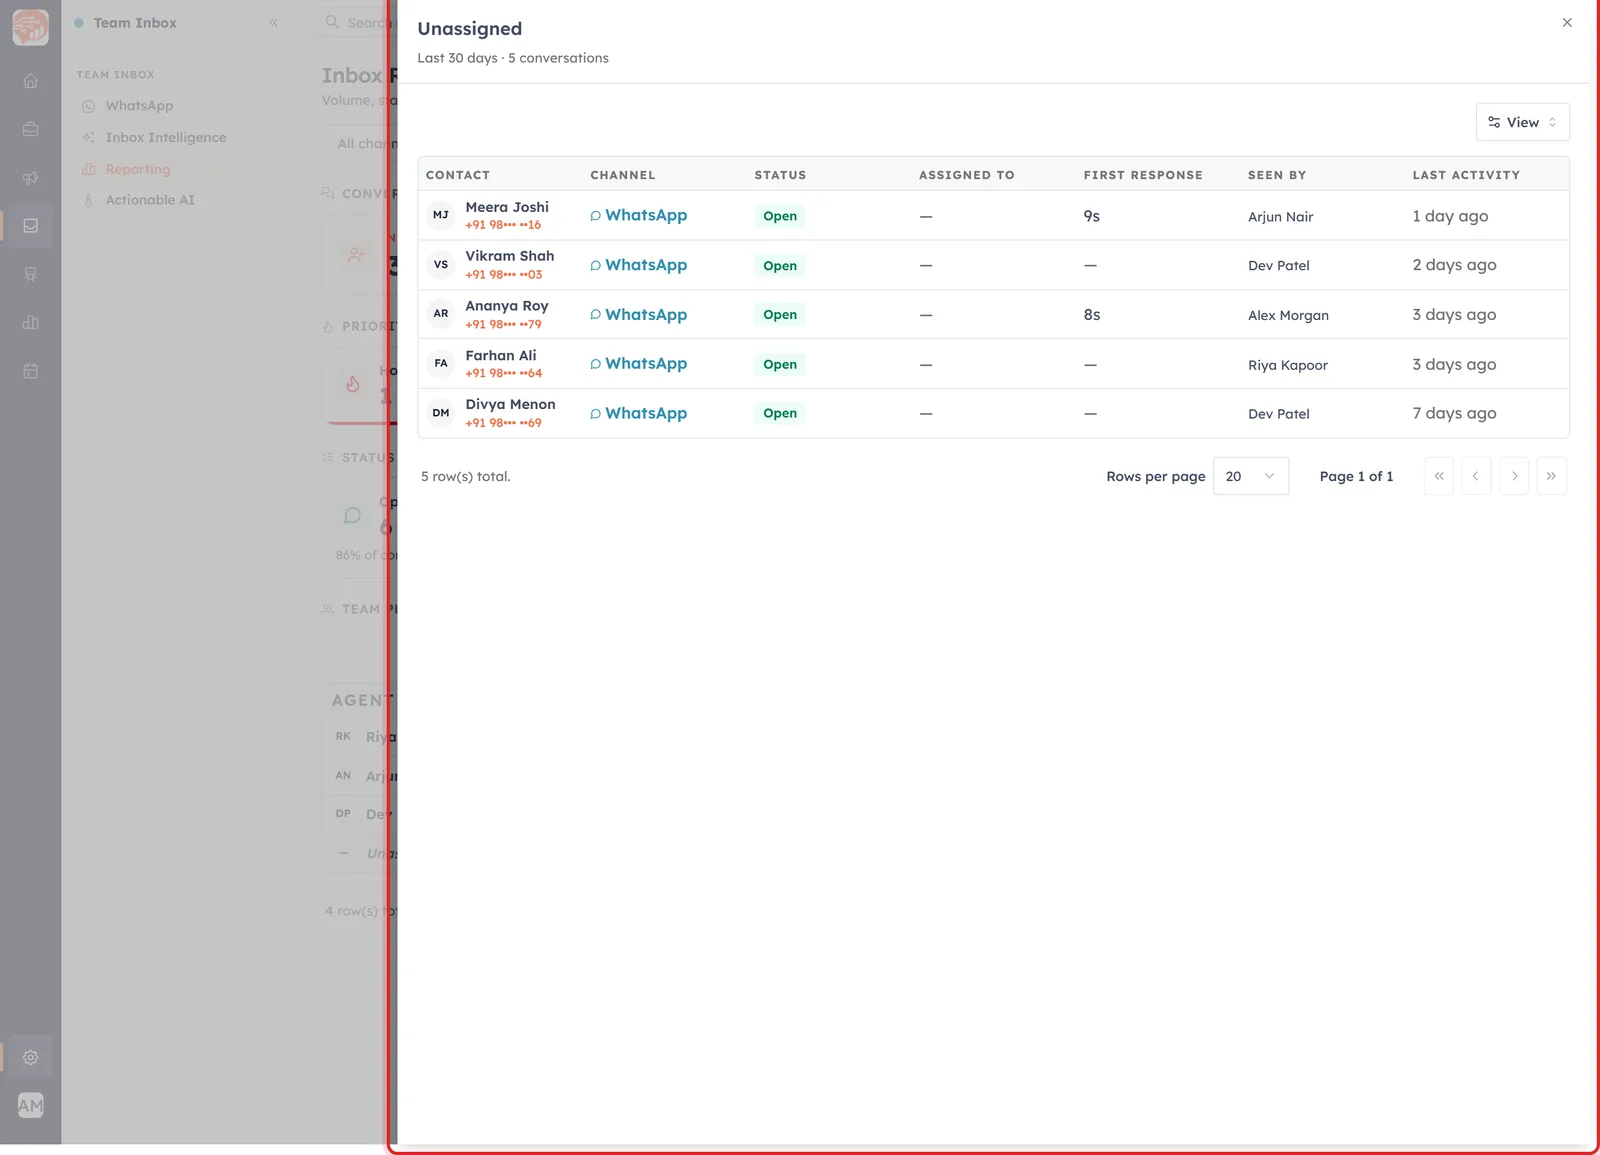
Each row shows:
Contact — who it is, with their number. Click through to open the record.
Channel — where the conversation came in.
Status — Open, On Hold, Solved or Blocked.
Assigned to — the owner, or a dash if it’s still in the open pool.
First response — how long the customer waited for the first reply (a dash means they’re still waiting).
Seen by — who has opened the chat, which is often the fastest way to find out why nobody replied.
Last activity — when anything last happened on the thread.
The New contacts and Qualified by AI tiles open a similar panel, but listing people — contact, email, phone, owner and created date — so you can follow up on the leads the inbox produced.
How to use it in practice#
Every morning: set the range to Today, look at Unassigned, click it, and get those chats owned.
Every week: set Last 7 Days and scan the Never replied column for red badges. Each one is a customer who never heard back.
Every month: compare New contacts and Total conversations against last month to see whether the channel is growing.
Reviewing one person: pick them in the user filter — the whole page, not just the table, narrows down to their work.
Good to know#
Bot and website chats are counted in volume only. They have no assignee, status or response target, so they never appear in the status, priority or team sections.
You only see what you’re allowed to see. Agents whose access is limited to their own chats see a report built from their own conversations; managers and admins see the whole team.
Everything obeys the date range. A tile that reads zero usually means “nothing in this window”, not “nothing at all” — widen the range to Any Time to check.
Numbers are calculated in your organisation’s time zone, so “Today” means your working day, not UTC.
ℹ️
Want alerts rather than a screen you have to visit? See WhatsApp Inbox Notifications to get notified when new messages arrive, and WhatsApp Inbox: Manage Conversations with Your Contacts for assigning, holding and solving chats.
Was this article helpful?
Ready to implement this?
OpenAI Engage and apply what you just learned to your own workspace.
Open AI Engage CRM