Loading…


KnowledgeBase
Advertising Analytics: Unified Ad Performance & Cost Per Lead
The Advertising Analytics page pulls every advertising platform you run — Meta Ads, Custom Advertising, and anything else that writes into your ad-performance history — into one report. Instead of a separate dashboard per integration, you get a single grid where Spend, Leads and Cost Per Lead sit side by side, so you can compare channels honestly and see where each lead actually comes from.
Before you start#
Open the report from the Ads & Analytics rail at Ads & Analytics → Analytics.
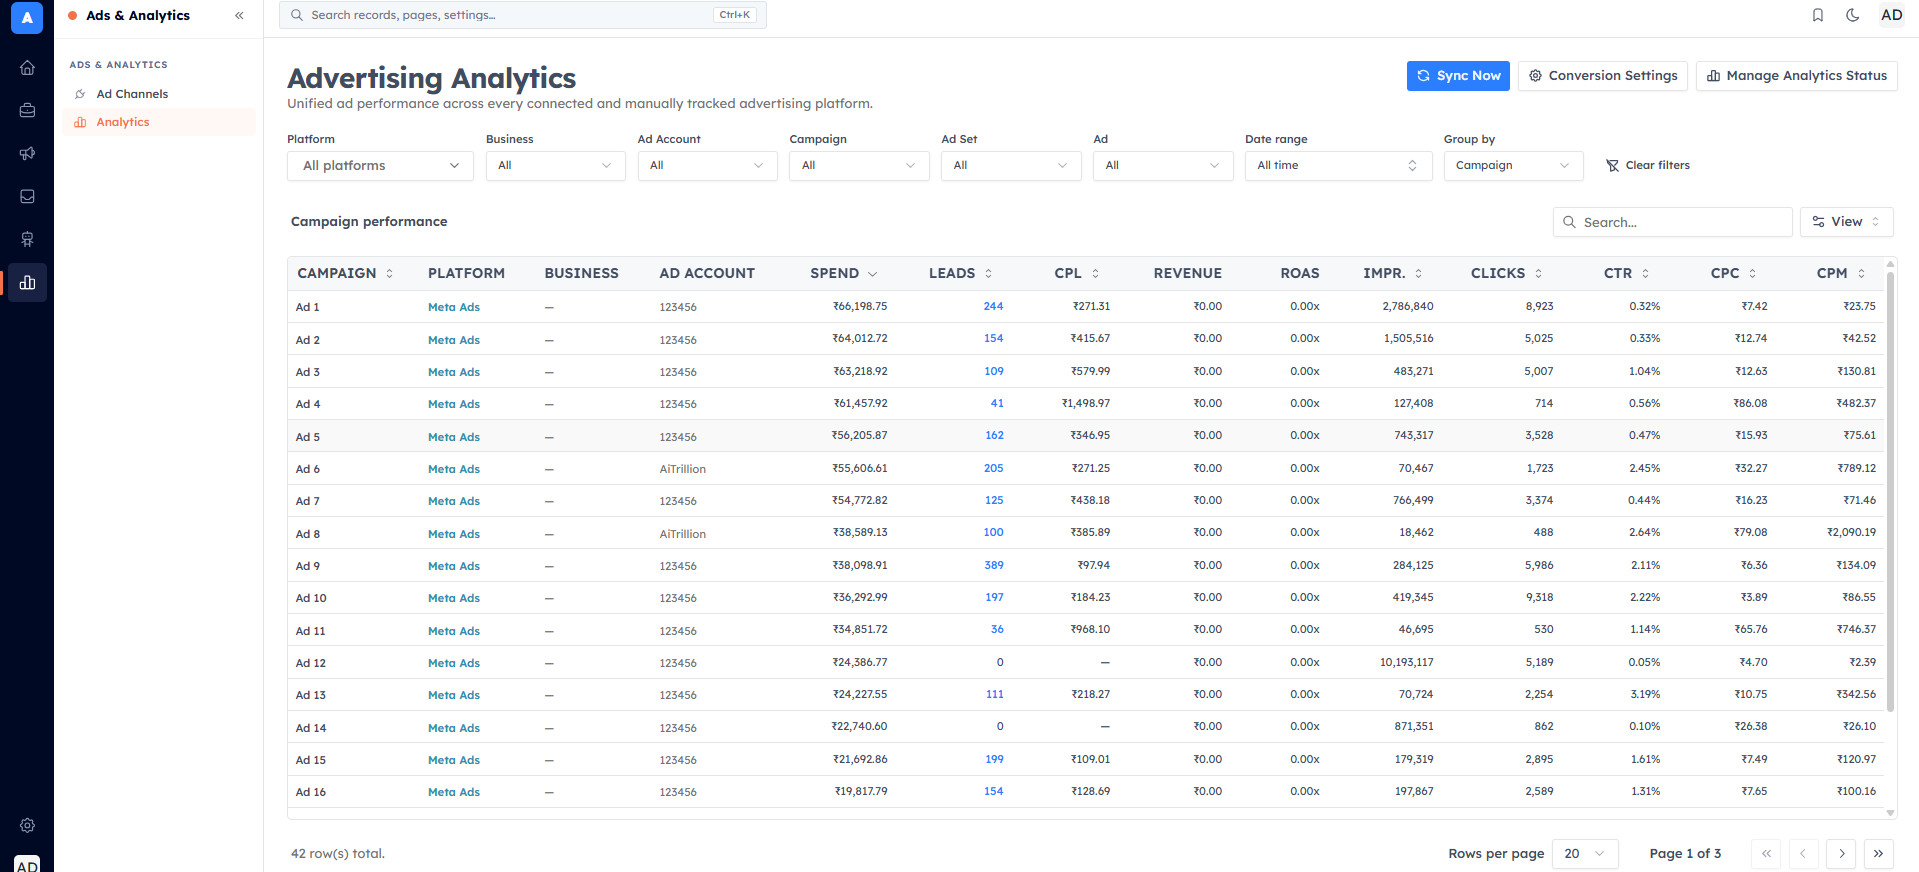
Two facts shape everything below:
Reporting is independent of collection — the report always renders whatever history has been collected, with no activation gate. Turning tracking off never hides data that was already collected.
Collection is controlled per platform — whether a platform is currently gathering new data is governed by its Analytics Tracking switch, which you manage from Manage Analytics Status on this page.
To bring a platform online, first connect it from Ad Channels: Meta via Connect Meta Lead Ads, and offline media via Track Offline Advertising with Custom Campaigns.
💡
Enabling or disabling Analytics Tracking only controls whether new data is collected. Disabling it preserves everything already synced — the toast confirms "Meta analytics tracking disabled. History is preserved."
Read the performance grid#
The grid is dimension-agnostic: a Group by selector regroups the same rows by any level of the ad hierarchy. Each row carries these metrics:
Spend — total amount spent, in the row's own currency.
Leads — attributed leads for the row. When the count is above zero it is a link — click it to open the exact CRM contacts behind that number.
CPL — cost per lead (spend ÷ leads), auto-calculated.
Revenue — live conversion revenue. Shows a dash until Conversion Tracking is configured or nothing has been attributed.
ROAS — return on ad spend. Like Revenue, it is derived from your conversion rule and is not column-sortable.
Impr., Clicks, CTR, CPC, CPM — standard delivery metrics.
Spend, Leads, CPL, Impr., Clicks, CTR, CPC and CPM are sortable; Revenue and ROAS are not.
Filter and group#
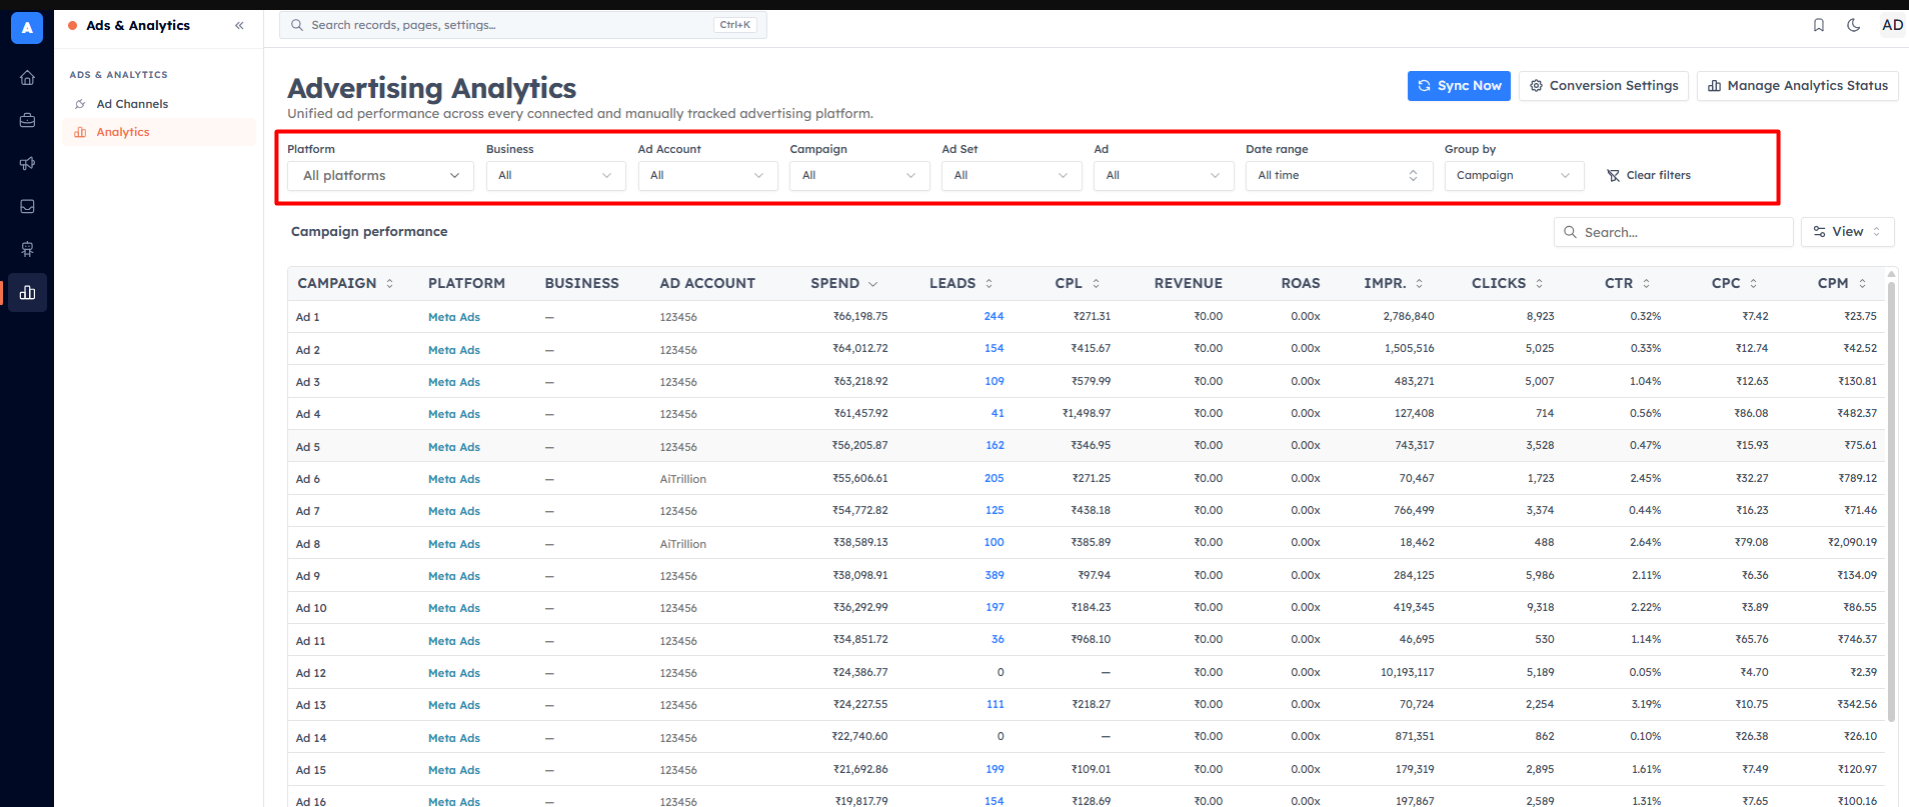
Filters read left-to-right, with Platform first because it decides which of the cascade filters apply:
Platform — multi-select across all connected/tracked platforms. Selecting a single non-Meta platform (such as Custom Advertising) simplifies the view: the Meta-only Business, Ad Account, Ad Set and Ad columns hide and Group by collapses to Campaign / Ad Spend.
Business → Ad Account → Campaign → Ad Set → Ad — a cascade; picking a level clears its descendants. A level is hidden when it has no options for the current scope.
Date range — presets or a custom window; defaults to All time.
Group by — regroups the grid by Platform, Business, Ad Account, Campaign, Ad Set or Ad. The default is Campaign.
Clear filters — restores the pristine view, including Group by back to Campaign.
Every filter, sort, page and group choice is stored in the URL, so a refresh or browser Back returns you to exactly the same view. Clicking a row drills into its detail page.
💡
Any Leads number in the grid is a doorway to the underlying contacts — click it to answer "which people did this campaign actually bring in?" without leaving the report.
Sync Now#
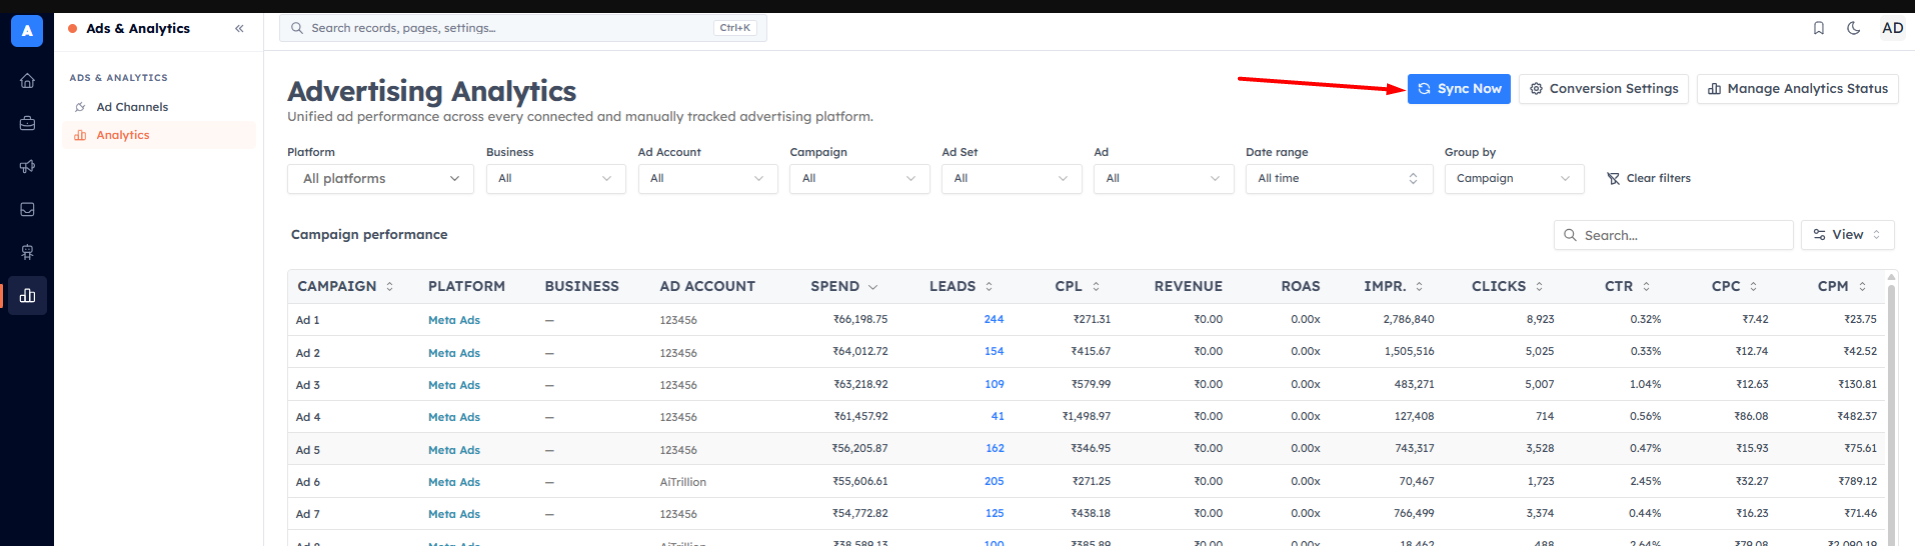
The Sync Now button opens a platform picker. Only platforms that are connected and have Analytics Tracking on can be synced — the rest show a Tracking off badge and the hint "Enable tracking to sync this platform." Pressing Sync starts a background run and confirms with a "sync started" message; new data appears shortly.
Manage Analytics Status#
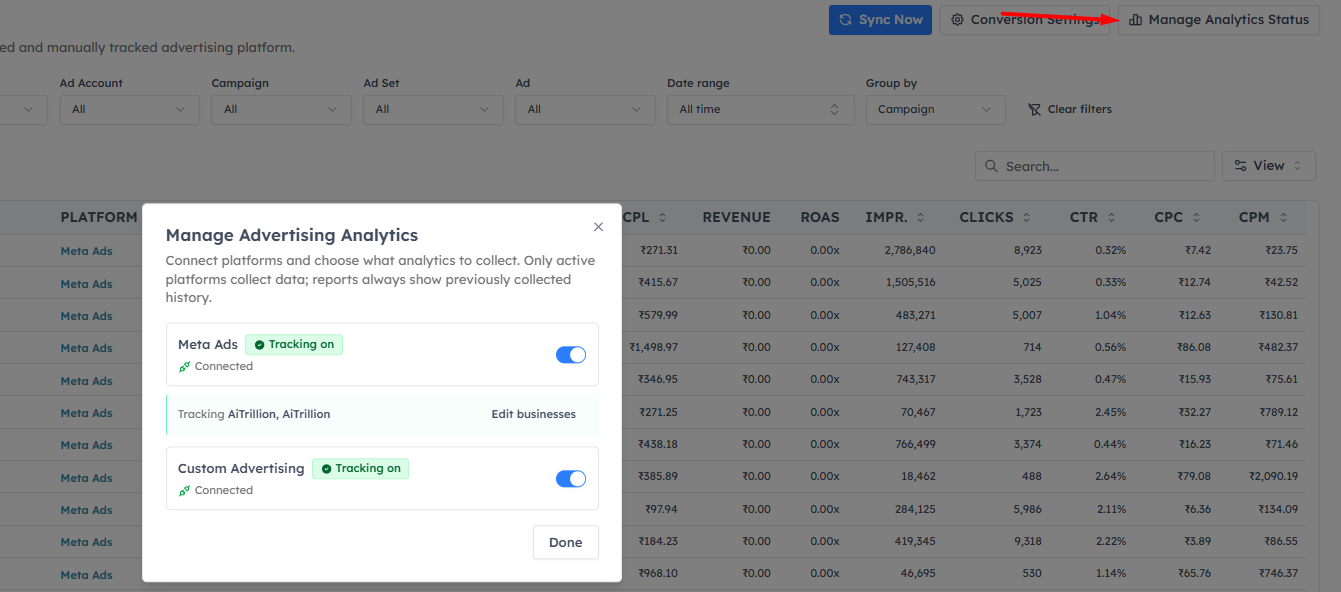
Manage Analytics Status is the single place to turn collection on or off. Each platform row shows Connected/Not connected and a Tracking on/Tracking off badge:
Meta Ads — if not connected, Connect; otherwise Enable Tracking opens a Business picker. Analytics then collects every ad account under the Businesses you select and nothing else. Save & Sync runs the first sync while a progress panel walks through "Platform connected → Tracking enabled → Businesses saved → Fetching campaigns, ad sets, ads & insights", ending on "Analytics Successfully Enabled". Use Edit businesses to change the scope later.
Custom Advertising — has no Businesses step; once enabled it is always active. Toggle it directly with Enable Tracking.
Conversion tracking#
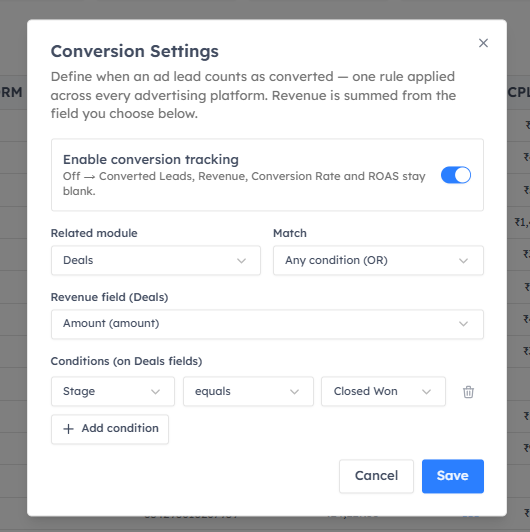
Until you configure conversions, a banner reads "Conversion Tracking is not configured." with a Configure Now button. That one global rule is what fills in Revenue, ROAS, Converted Leads and Conversion Rate across every platform — see Configure Conversion Tracking: Revenue, ROAS & Converted Leads.
💡
Revenue and ROAS staying blank is expected on a fresh account — they only populate once a conversion rule is enabled and leads are attributed to a revenue-bearing record.
Good to know#
The report never makes live platform calls — it reads locally synced history, so it stays fast and works even if a platform is temporarily unreachable.
An empty grid for a window simply means no records were collected for that scope, not that anything is misconfigured.
Custom Advertising rows are contributed by your manually tracked campaigns — the currency shown per row is the currency set on that campaign.
Was this article helpful?
Ready to implement this?
OpenAI Engage and apply what you just learned to your own workspace.
Open AI Engage CRM