Loading…


KnowledgeBase
Pivot Reports: Group & Summarize
From a flat list to grouped totals#
A tabular report lists one row per record. A pivot report groups those records together and shows totals — for example "total deal value by stage" instead of a long list of individual deals. You don't switch to a special mode: the builder turns your report into a pivot automatically as soon as you add a grouping.
Row Groups#
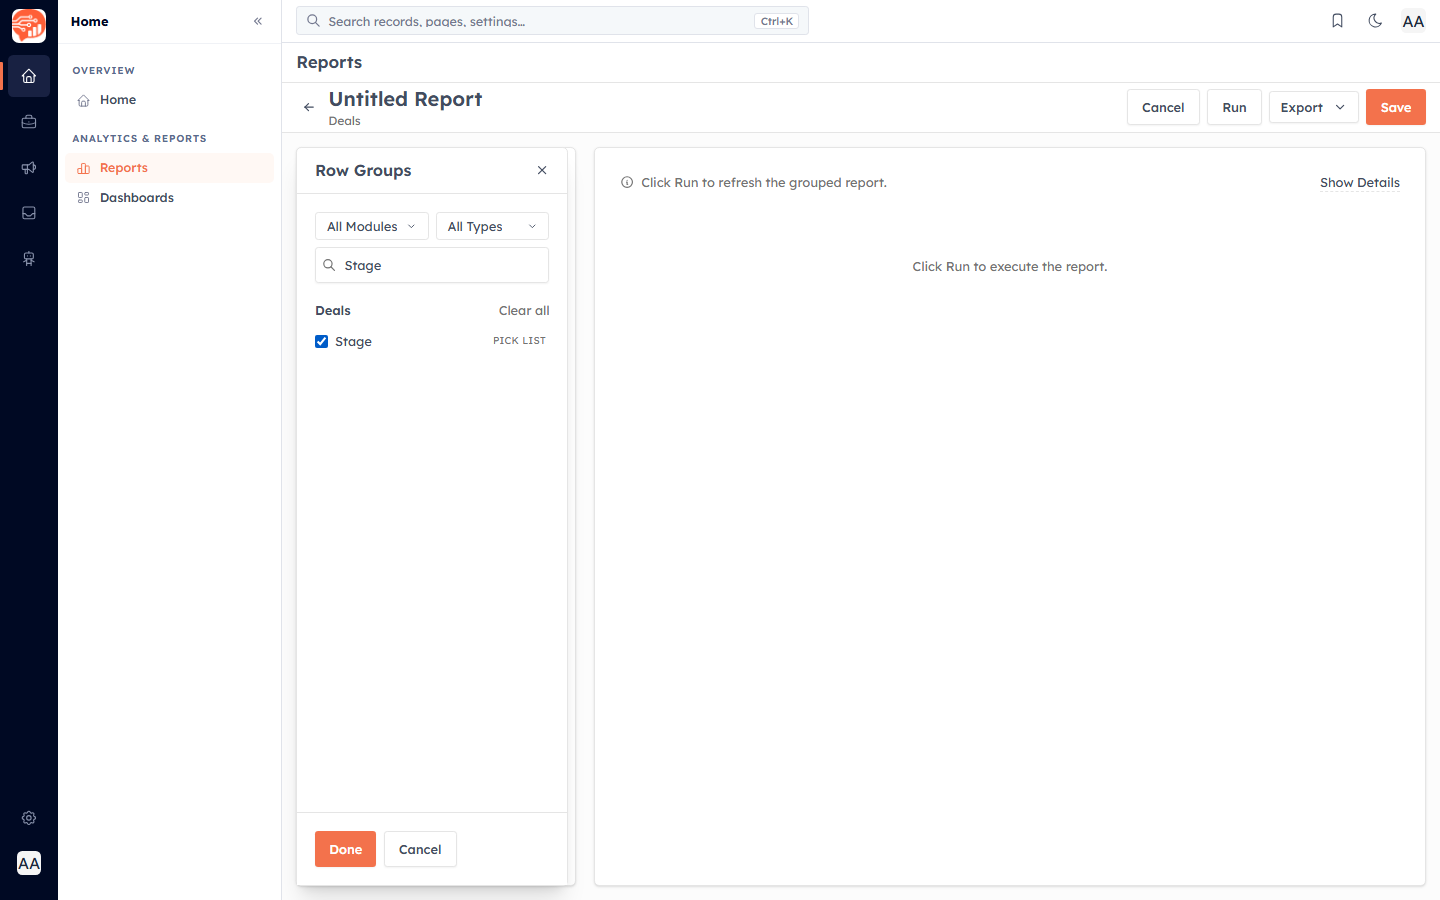
Under the Columns tab, open Row Groups and pick a field to group the rows by — for example Stage. Each unique value becomes a group.
Column Groups#
Column Groups work the same way but spread the values across the top of the report, so you can read one dimension down the side and another along the top (a cross-tab).
Aggregate Columns — the totals#
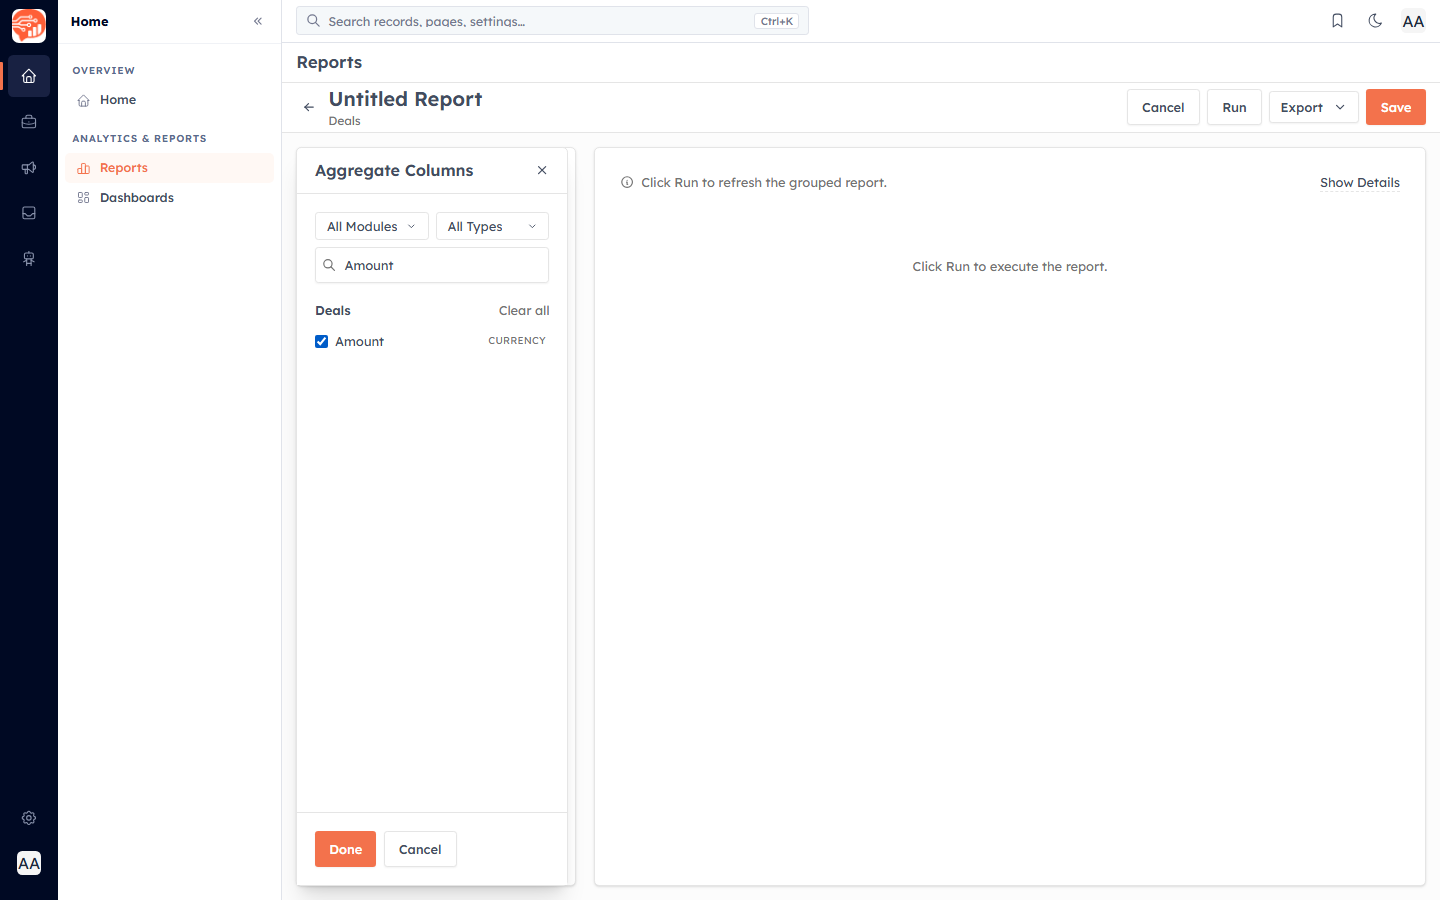
Aggregate Columns is where you choose the number to calculate for each group. Pick a numeric field (such as Amount) and a function. The available functions are:
Sum — add the values together
Average — the mean value
Min / Max — the smallest / largest value
Count — how many records are in the group (works on any field)
💡
Sum, Average, Min, and Max only work on numeric fields. If you just want a headcount, use Count — it works on any field.
Review the configuration#
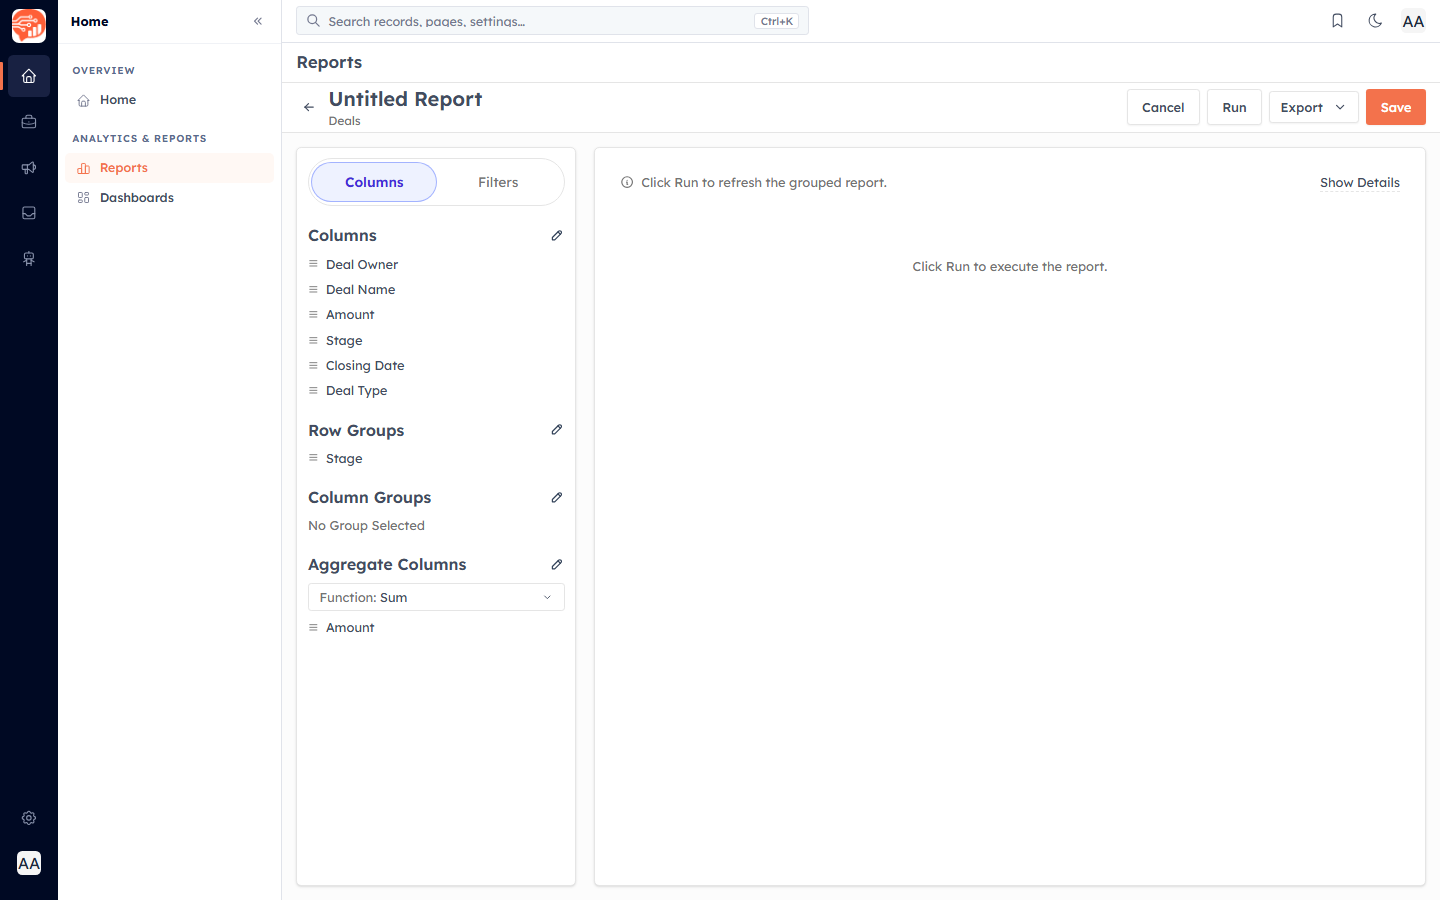
Your left panel now shows the grouping and the aggregate together — for example Row Groups: Stage, Aggregate Columns: Sum of Amount.
Run the pivot#
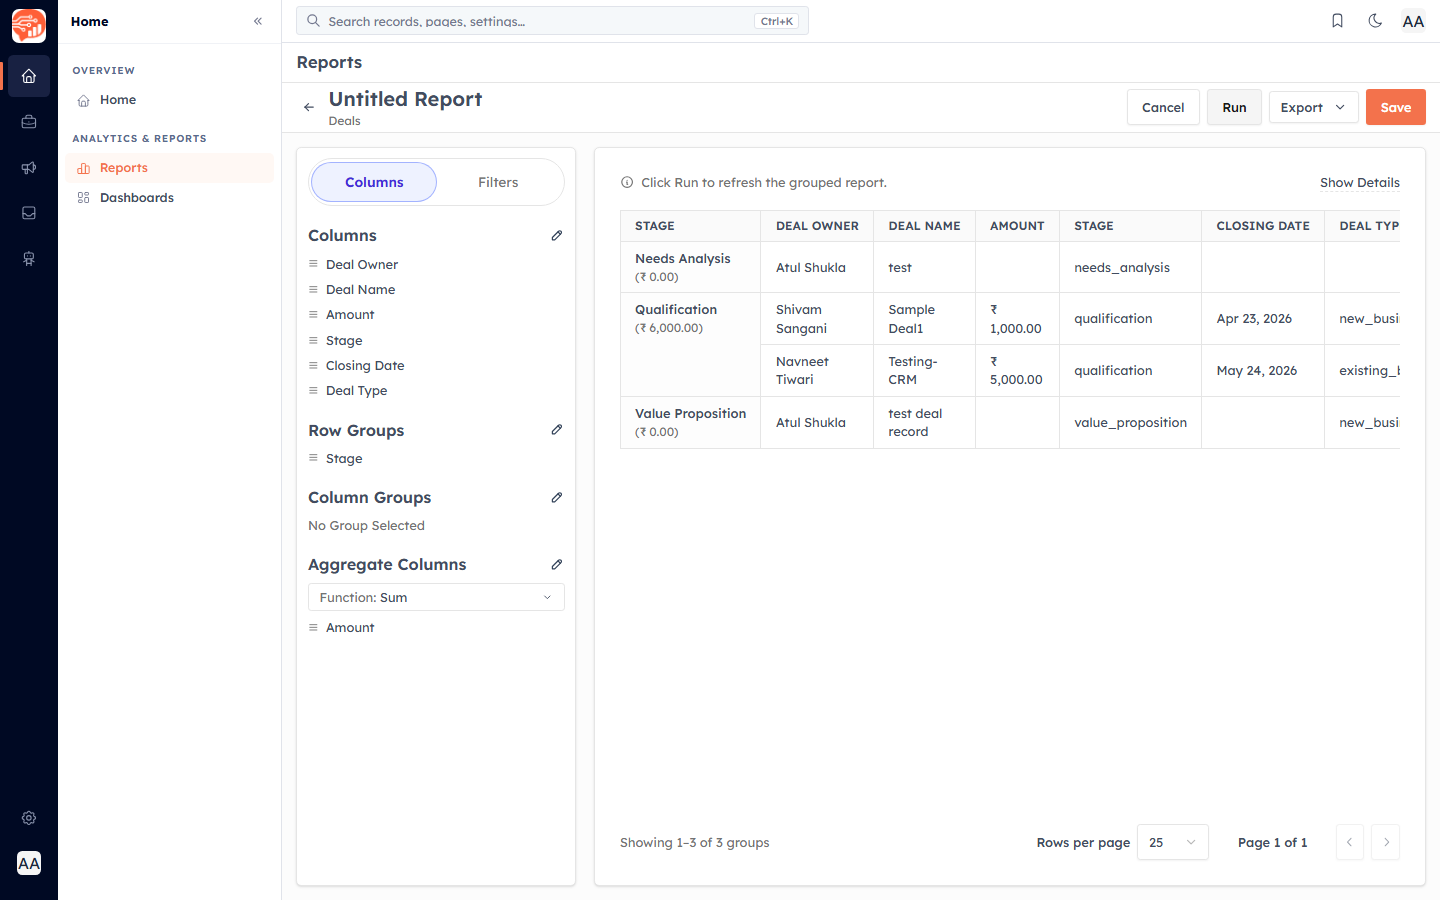
Click Run to calculate the grouped report. Each group shows its total, with the contributing records underneath.
Display options#
Use Show Details (top right of the preview) to toggle how the pivot is presented — including Detail Rows, Sub Totals, Grand Totals, and Wrap Text.
💡
A pivot report is capped at 2,000 records and 5,000 cells. If you hit the limit, add a filter (such as a date range) to narrow the data before grouping.
Was this article helpful?
Ready to implement this?
OpenAI Engage and apply what you just learned to your own workspace.
Open AI Engage CRM