Loading…


KnowledgeBase
Report Builder: Build a Tabular Report
What the Report Builder is#
The Report Builder lets you create a report from scratch to answer a question the numbers on your dashboard don't. You choose the module, the columns, the filters, and how the data is grouped. Open it from Reports in the left sidebar (under Analytics & Reports).
The simplest report is a tabular report — a flat list of records with the columns you pick. The moment you add a grouping it becomes a pivot report instead (covered in the next article).
Step 1 — Create a report and choose the primary module#
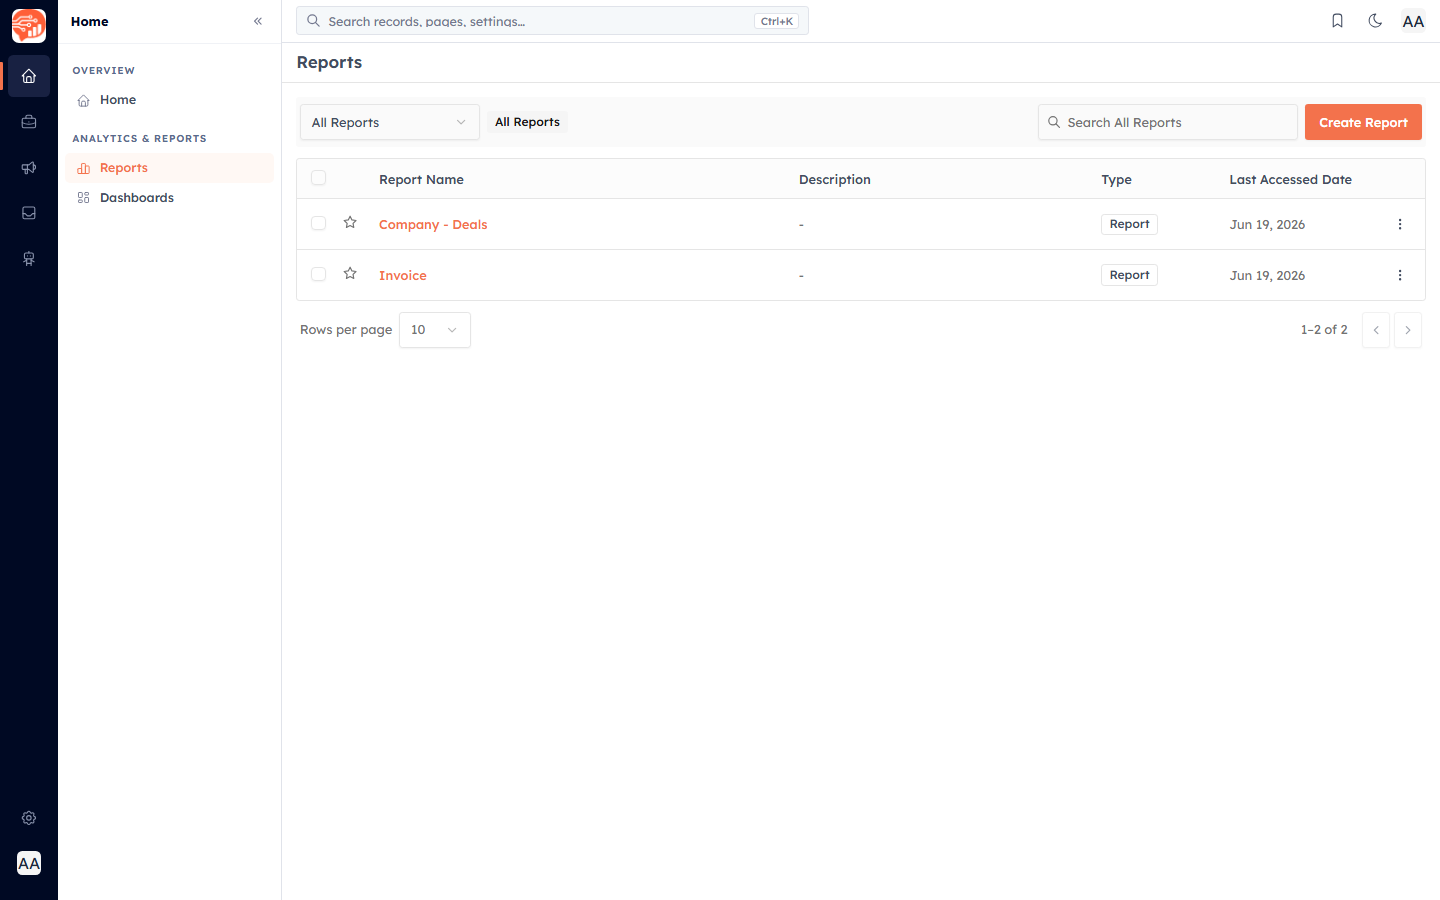
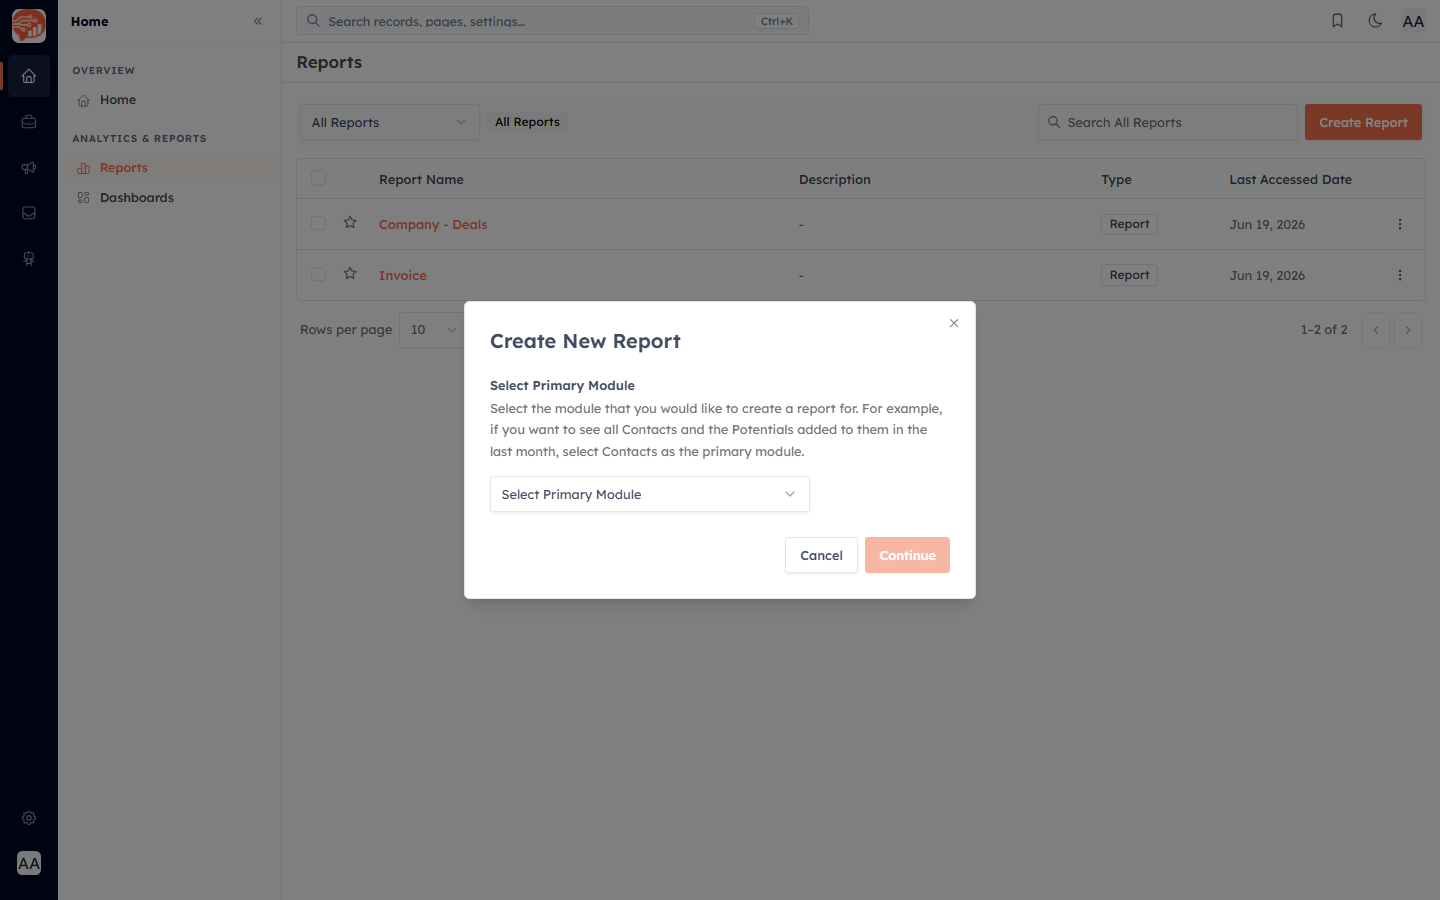
Click Create Report. In the Create New Report dialog, pick the Primary Module — the module that holds the data you want to report on (for example Deals). Every report is built on exactly one primary module.
Step 2 — Add a related module (optional)#
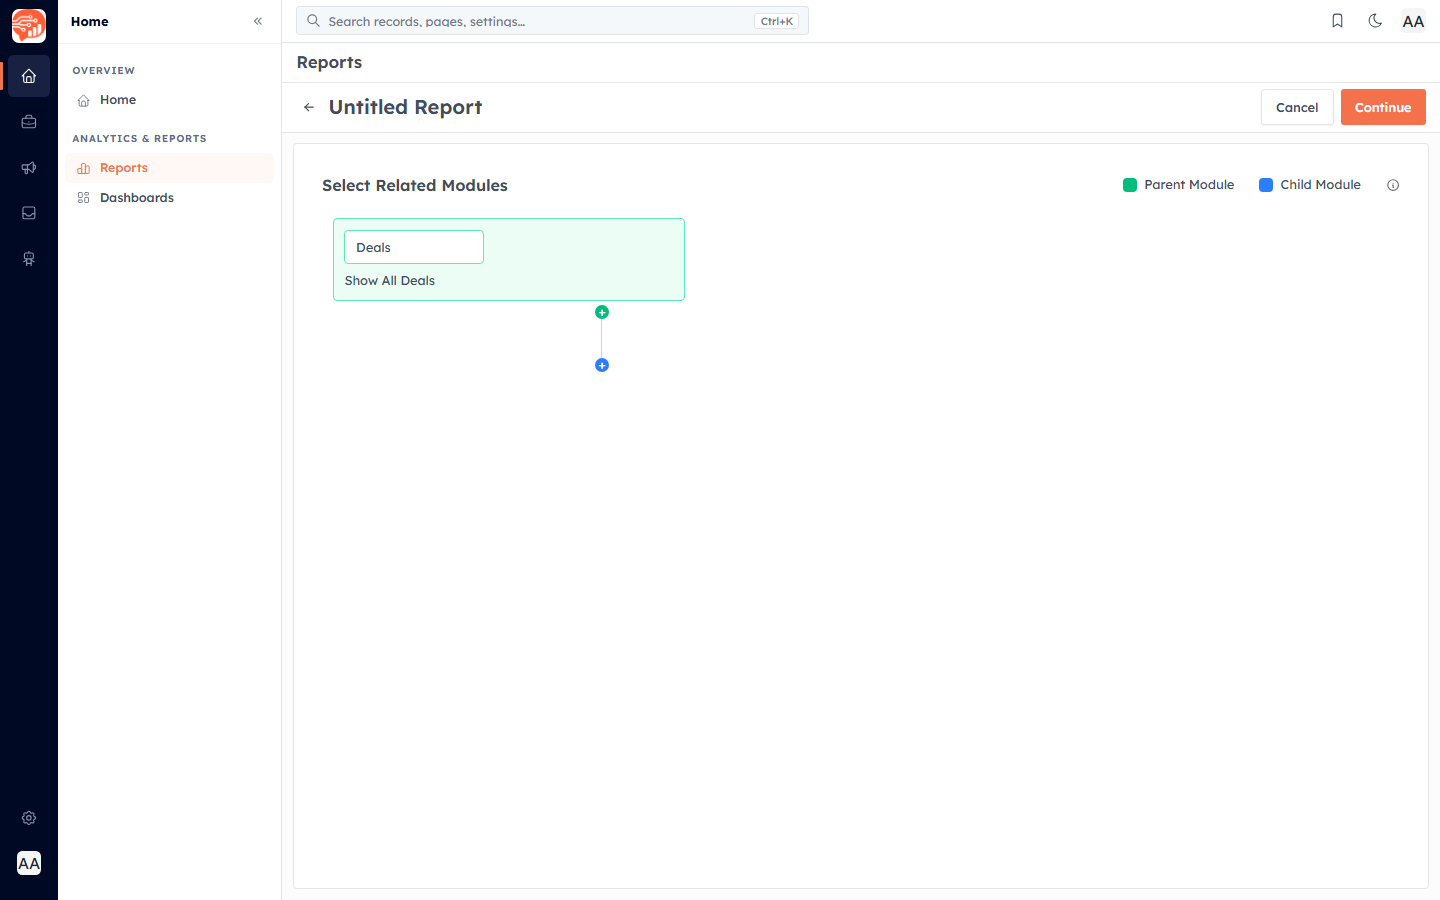
On the Select Related Modules step you can pull in one directly related module (the parent is shown in green, the child in blue). You also choose how the two are joined:
Both — with or without the related module — includes every primary record, even those with no related record (a left join). This is the default.
Only parent records that have a related record — drops primary records that have no match (an inner join).
If you only need one module, just click Continue to skip this step.
Step 3 — Get to know the builder#
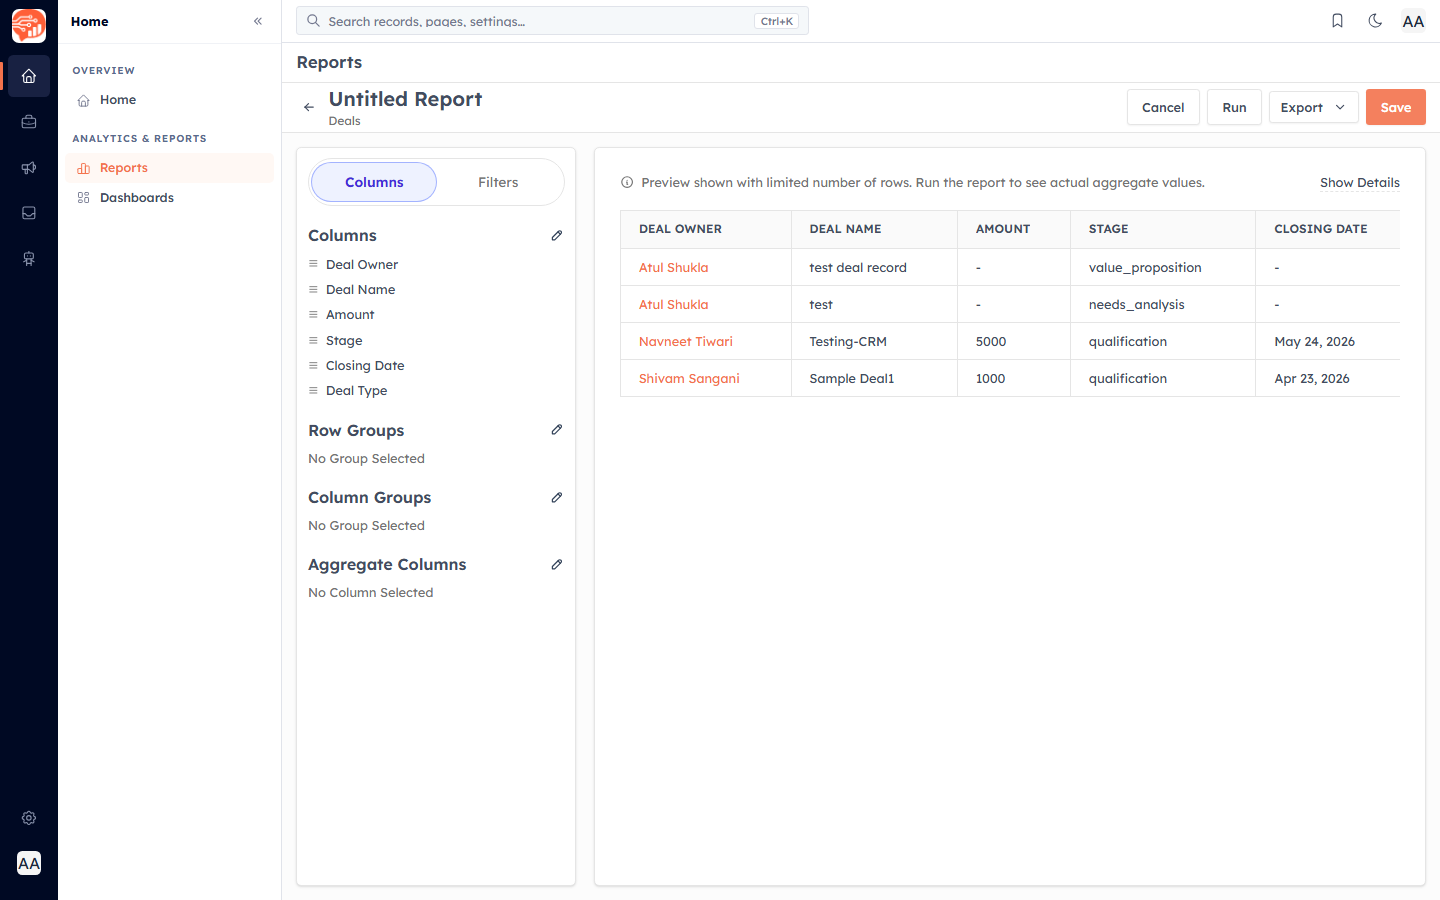
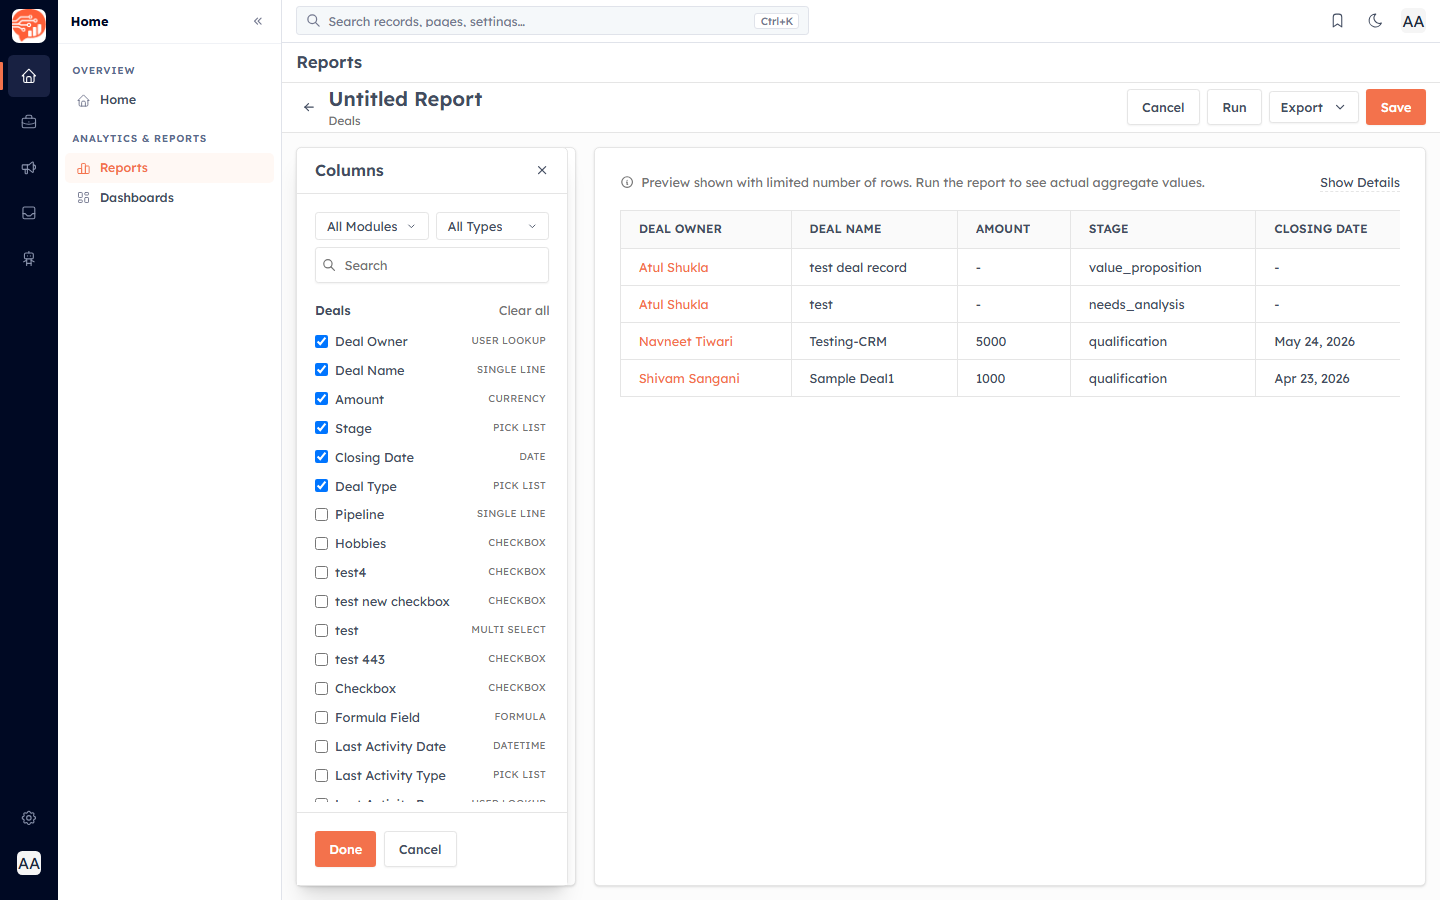
The builder has two panels. On the left is a Columns / Filters tab strip; on the right is a live preview that updates as you work. The header holds Cancel, Run, Export, and Save.
Step 4 — Choose your columns#
Under the Columns tab, the Columns section lists the fields shown in the report (it starts with the first few fields of the module). Click the pencil to open the field picker, then tick the fields you want — you can filter the list by module or field type, or search by name.
💡
Add only the columns you actually need. A focused report with 5–6 meaningful columns is far easier to read than one with everything.
Step 5 — Sort the results#
Click any column header in the preview to sort by it — click again to switch between ascending and descending. Sorting applies to the whole dataset, not just the visible page.
Step 6 — Run and review#
The preview shows a limited number of rows as you build. Click Run to execute the report against your live data and page through the full result set.
💡
A saved report always runs against the latest data — every time you open it, the numbers are current.
Saving your report#
When it looks right, click Save, give it a name, and choose who can see it. See Saving, Sharing & Managing Reports for the details.
Was this article helpful?
Ready to implement this?
OpenAI Engage and apply what you just learned to your own workspace.
Open AI Engage CRM