Loading…


KnowledgeBase
Dashboards & Report Components
What is a Dashboard?#
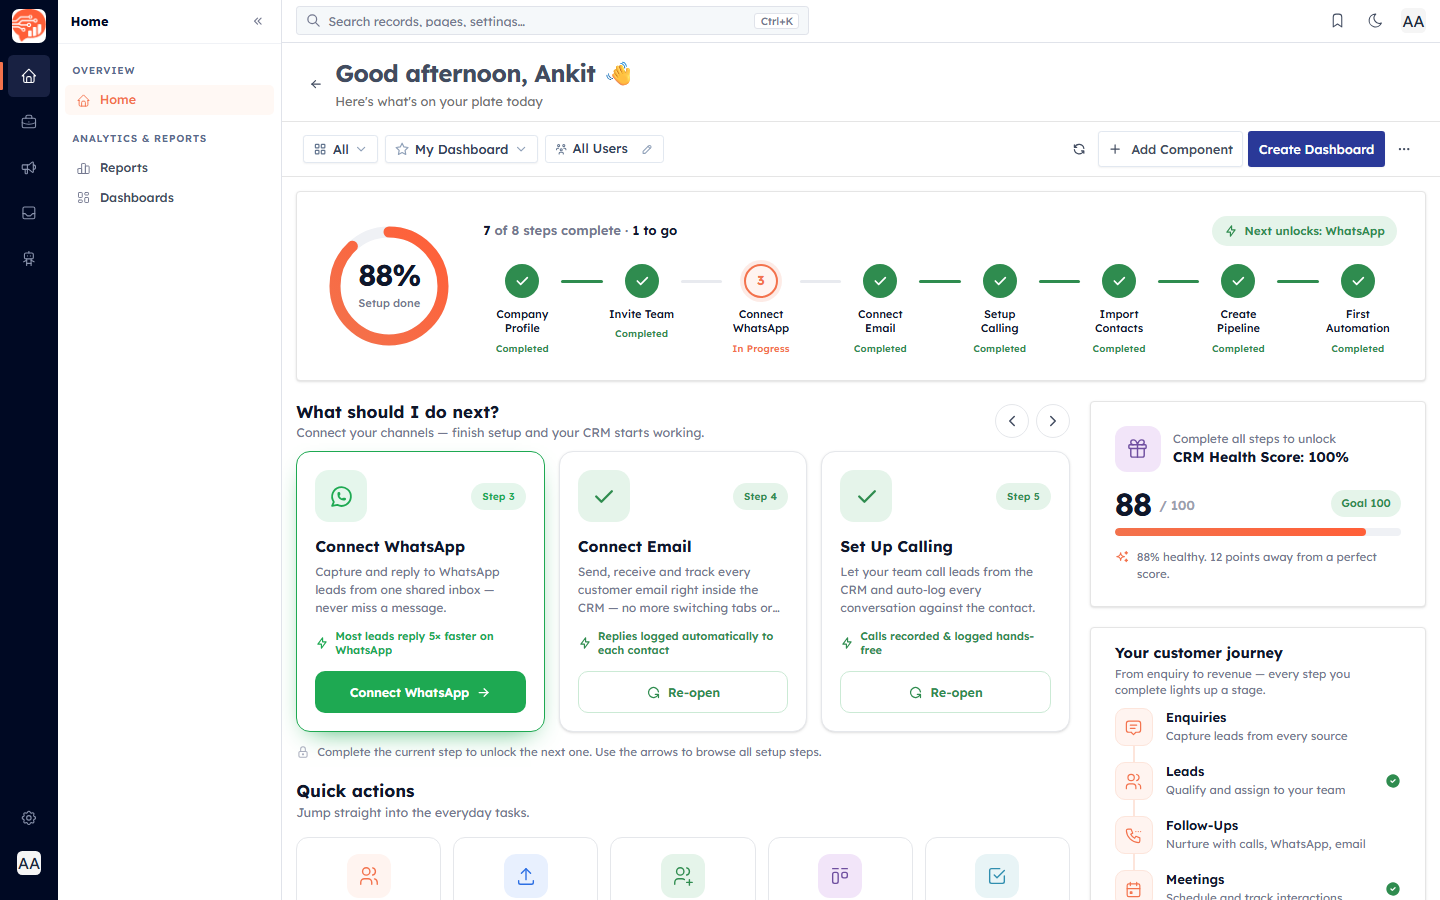
A dashboard is a single page that shows several charts and numbers at the same time. Instead of opening five reports, you open one dashboard and see everything at once — perfect for the metrics you check every morning.
Managing your dashboards#
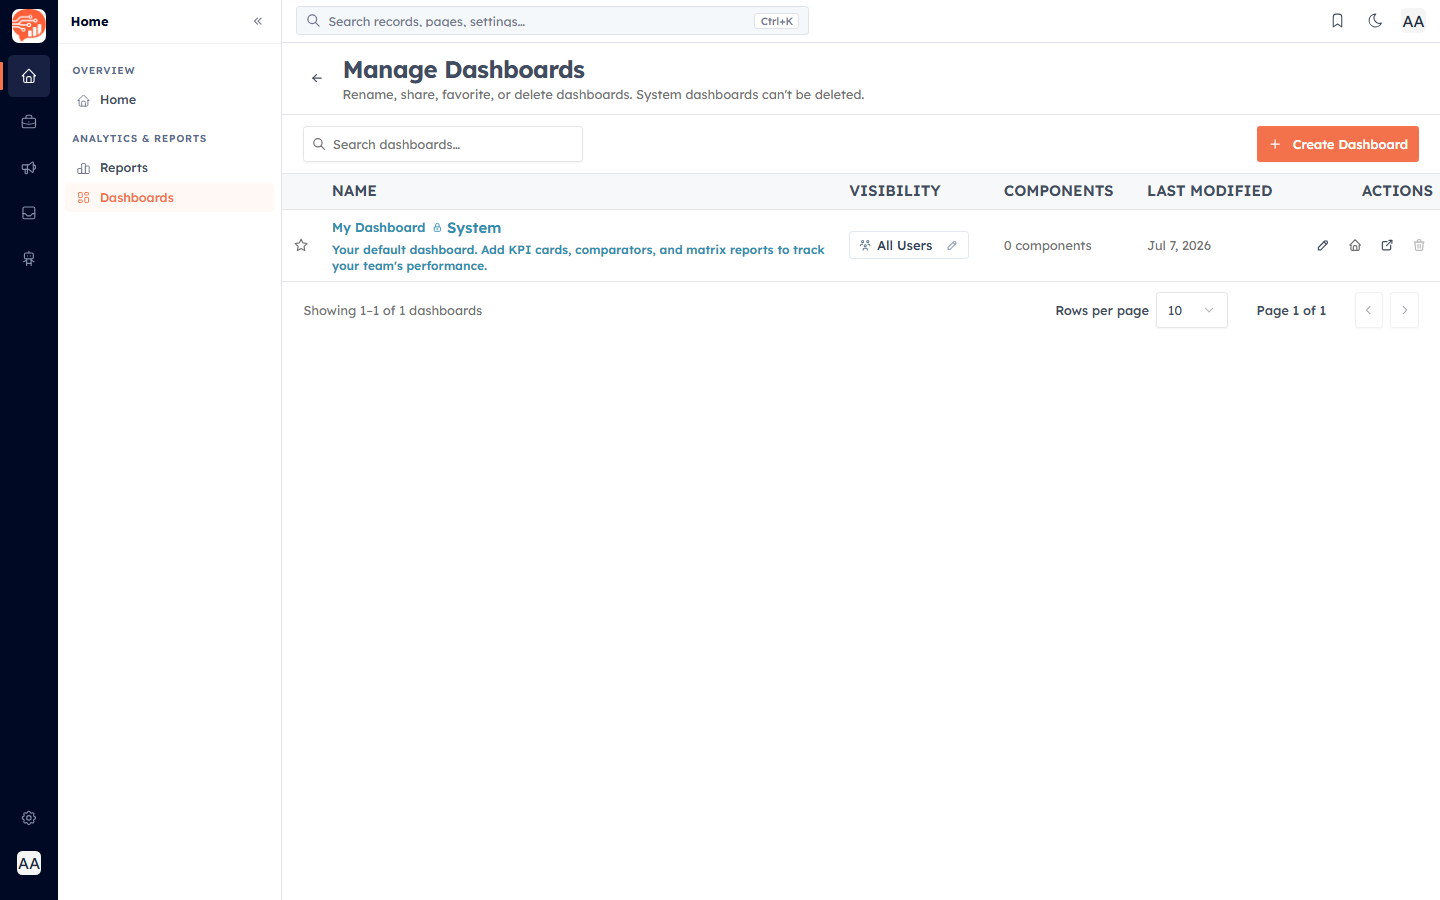
Open Dashboards from the sidebar. The Manage Dashboards screen lets you rename, share, favourite, or delete your dashboards (system dashboards can't be deleted). Use Create Dashboard to start a new one.
Adding components#
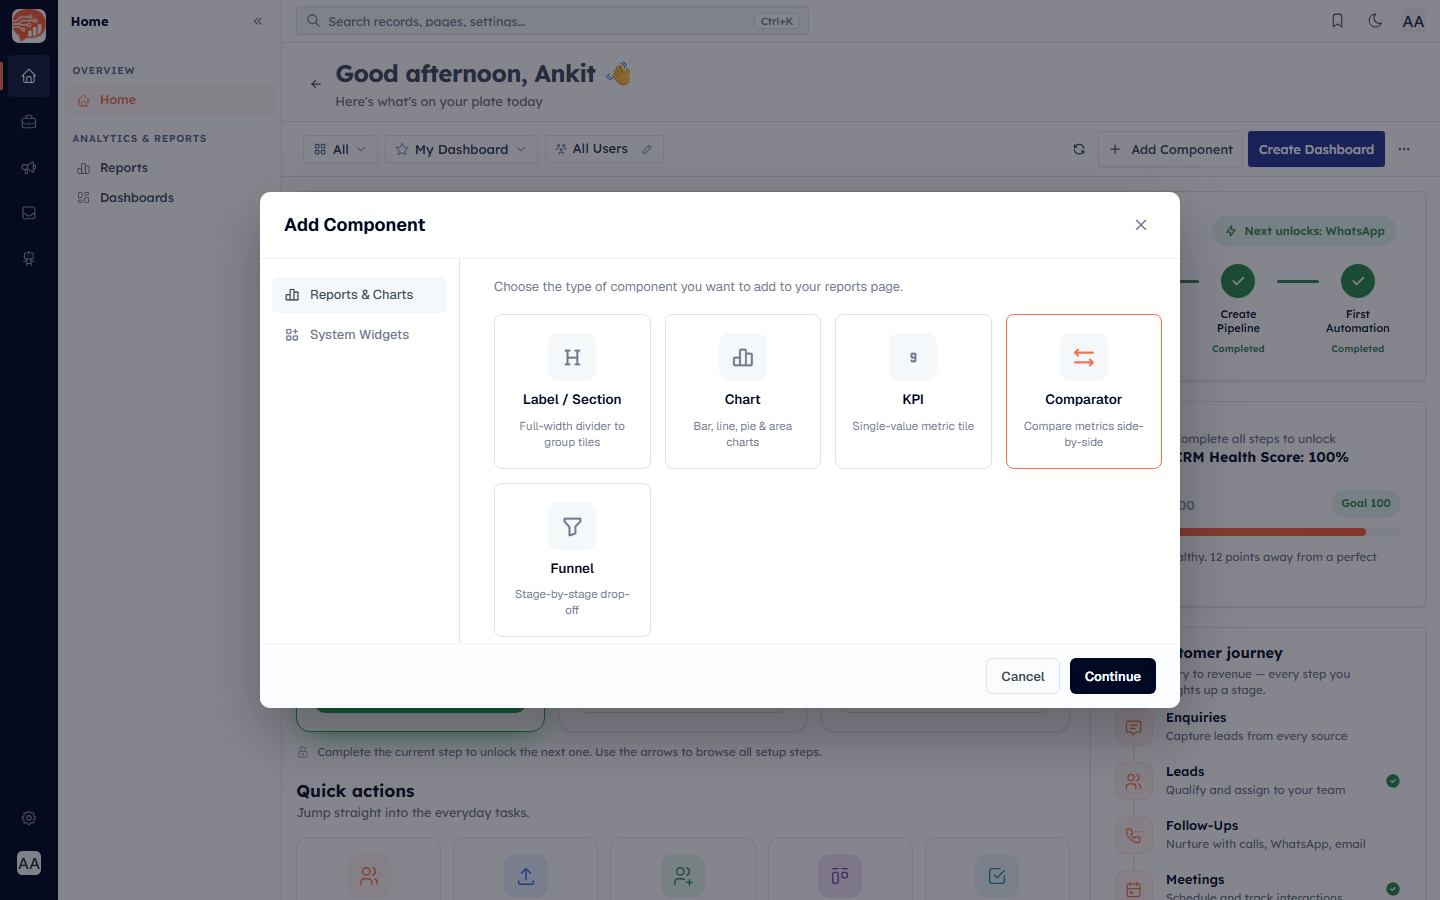
A component is one tile on the dashboard. Click Add Component and choose the type — a Label/Section divider, a Chart, a KPI card, a Comparator, or a Funnel.
ℹ️
Each component type is configured with its own builder. For what each one does and how to set it up, see Report Types: KPI, Comparator, Matrix & Funnel.
Organise with Labels & Sections#
Add a full-width Label / Section heading between tiles to group related components and make a busy dashboard readable. See Dashboard Labels & Sections for the full styling options.
Arrange and drill down#
Drag components to rearrange them and resize them to fit. Click into a chart or KPI to drill down and see the individual records behind a number.
Filter the whole dashboard#
Add a global date filter so one date range applies across the dashboard, instead of changing each tile. See The Dashboard Global Date Filter to set it up.
Sharing a dashboard#
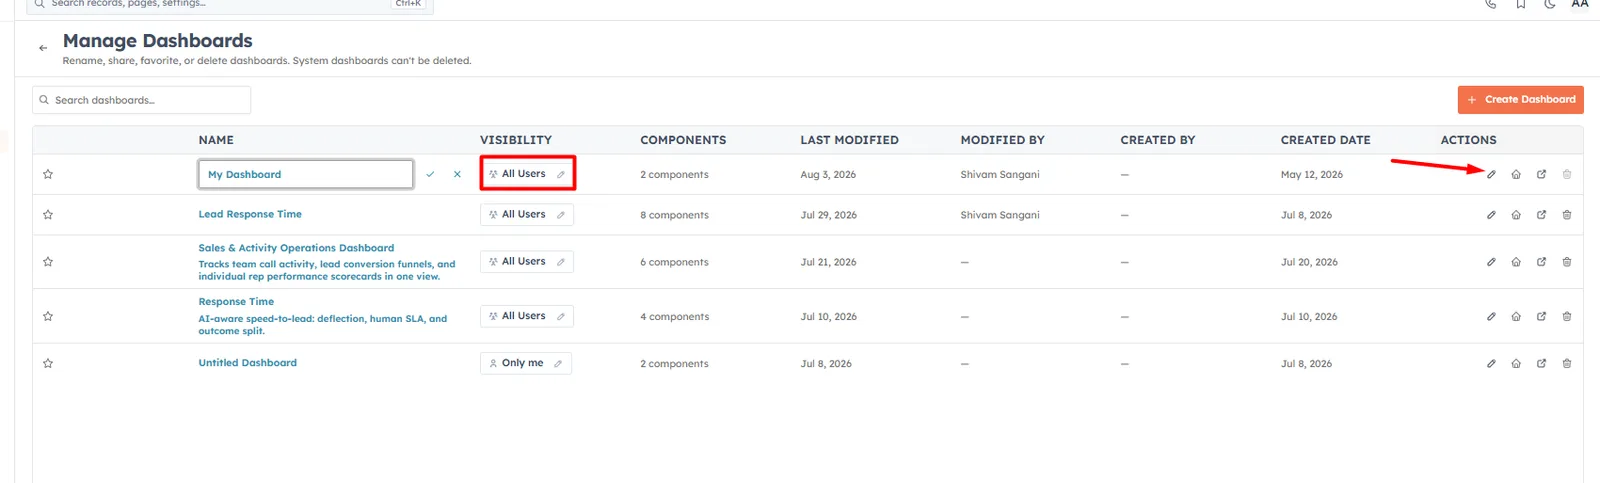
By default, a dashboard you create is visible only to you. Click on Dashboard, click on Edit Icon to change the visibility to All Users or specific teams — managers often build one shared team dashboard so everyone sees the same numbers.
✅
A well-built dashboard saves time every day by putting the numbers you check most in one place — no need to run individual reports.
🔗
Next: Dashboard Labels & Sections.
Was this article helpful?
Ready to implement this?
OpenAI Engage and apply what you just learned to your own workspace.
Open AI Engage CRM